

WISeR Expands the Use of Prior Authorization in Traditional Medicare at a Time of Increasing Scrutiny
Authors: Alex Cottrill, Jeannie Fuglesten Biniek, Juliette Cubanski, Tricia Neuman, and Misha Segal
Published: Feb 10, 2026Print
On January 1, 2026, the Center for Medicare & Medicaid Innovation (CMMI) launched the Wasteful and Inappropriate Service Reduction (WISeR) Model that establishes new prior authorization requirements in traditional Medicare. The model tests the use of technologies such as artificial intelligence to review the appropriateness of select services in six states over a six-year trial period. Prior authorization requirements are used routinely by Medicare Advantage plans and other private insurers, but rarely in traditional Medicare. Prior authorization aims to reduce unnecessary or inappropriate utilization of health care services, but it can also lead to delays and denials of needed medical care, uncertainty for patients, and administrative costs and hassles for health care providers. Nonetheless, it remains a common feature of health insurance in the US, in part because it is one of the few tools available for insurers to manage utilization and spending on covered services.
The rollout of the WISeR model comes at a time when roughly seven in ten US adults with health insurance (69%) say that prior authorization is a burden, and more than a third (34%) say that it is their single biggest burden, beyond costs, when it comes to getting health care. In July 2025, the Trump administration announced a voluntary effort in which dozens of private health insurers pledged to impose fewer prior authorization requirements and streamline the review process, and later that same week the administration announced the WISeR model to expand these types of requirements in traditional Medicare. Reflecting concern among some policymakers about the new model, an amendment to prohibit spending for the implementation of WISeR was approved by the House Appropriations Committee in September 2025 but was not included in the Consolidated Appropriations Act of 2026 that was signed into law in February 2026.
This analysis explores the potential impact of the WISeR model by examining recent spending and utilization trends in traditional Medicare for services selected for prior authorization requirements in the six model states (Arizona, New Jersey, Ohio, Oklahoma, Texas, and Washington), using 100% traditional Medicare claims data from the Chronic Conditions Warehouse (CCW) for 2019-2025. Services included in this analysis reflect the CPT code list provided in the CMS WISeR Model Provider and Supplier Operational Guide, as of December 10, 2025 (referred to throughout as “WISeR services”). Since this analysis was conducted, CMS has delayed the inclusion of two services originally scheduled for inclusion in 2026. These two services represent less than 1% of traditional Medicare spending on all WISeR model services during the years assessed. All results are rounded to the nearest hundred dollars or nearest hundred beneficiaries, unless otherwise noted.
The analysis suggests that the impact of the WISeR model is likely to be modest in its first year, both because WISeR services account for a small share of total Part B spending in traditional Medicare and a relatively small number of beneficiaries use these services, and because the vast majority of WISeR service spending and growth is accounted for by a single service category (skin substitutes), for which growth in spending is largely driven by increases in average service price. While prior authorization can be an effective tool for reducing wasteful or inappropriate service use, it has no direct impact on prices. CMS has simultaneously put in place nationwide changes to payment policy that standardize payment rates for skin substitutes, which went into effect on January 1, 2026. CMS estimates that these changes will reduce Medicare spending on skin substitutes by nearly 90% in 2026, which is likely to far exceed the impact on spending from changes in use that may result from prior authorization requirements under the WISeR model, which applies only to a subset of states. On the other hand, the potential for CMS to expand the WISeR model to include additional services and states means that more spending and more beneficiaries in traditional Medicare could be subject to prior authorization restrictions in future years, increasing the reach of the model with time.
Key Takeaways:
- WISeR services accounted for 5.3% ($12.3B) of all Part B spending in traditional Medicare in 2024, up from 1.1% ($2.4B) in 2019.
- Skin substitutes accounted for 83% ($10.3B) of WISeR service spending in traditional Medicare in 2024. Spending on skin substitutes was over 20 times higher in 2024 than in 2019 ($509.6M), while spending for all other WISeR model services was relatively flat over the five-year period.
- The growth in spending on skin substitutes was driven by a steep increase in price per service, which increased by 820%, on average, from 2019 ($2,300) to 2024 ($21,200), the largest increase in price per service for any WISeR service category during the period.
- Nearly 1.1 million traditional Medicare beneficiaries nationwide received at least one WISeR service in 2024, most of whom (86% or 908,000) received some type of orthopedic pain management service, while only 9.3% (98,000) received skin substitutes. Of the 1.1 million WISeR service users nationwide, 207,500 (19.7%) received a WISeR service in one of the six WISeR model states in 2024.
- Per capita spending on WISeR services varied considerably among the six WISeR model states in 2024, ranging from $202 in Ohio to $748 in Oklahoma (relative to $371 nationwide). Much of this variation was accounted for by variation in per capita spending on skin substitutes, which ranged from $143 in Ohio to $674 in Oklahoma (relative to $310 nationwide) and was driven by variation in both per capita utilization and price per service for skin substitutes.
Although Initially Limited in Scope, the WISeR Model Expands the Use of Prior Authorization in Traditional Medicare
According to CMS, the goal of the WISeR model is to test the use of artificial intelligence and similar technologies to conduct prior authorization for services at risk of fraud or misuse. For each of the six states selected for the model, CMS has partnered with a private health technology company to administer prior authorization review using these technologies, and companies will be eligible to receive a share of the savings associated with services that are denied as a result.
Since the announcement of the WISeR model in July 2025, physician groups and members of Congress have expressed concern about its potential impact on provider workloads and beneficiary access to needed services, particularly as health technology partners are rewarded based, in part, on the volume of care that they deny. An amendment to prohibit spending for the implementation of the WISeR model, as well as any future model that tests prior authorization in traditional Medicare, was adopted by the House Appropriations Committee in September 2025, but was not included in the Consolidated Appropriations Act of 2026 that was signed into law in February 2026.
Prior authorization requirements are rare in traditional Medicare. However, use of prior authorization in Medicare Advantage—where virtually all enrollees are required to obtain prior authorization for some services—has come under scrutiny in recent years for delays and denials of medically necessary care and increased administrative burden for providers. In particular, several large insurers have been investigated by Congress and faced lawsuits due to inappropriate coverage denials based on artificial intelligence tools, such as proprietary algorithms that substantially increased denial rates for post-acute care services and often operated without human oversight. While the WISeR model will initially only apply to a limited set of health care items and services, CMS has stated that the model may be expanded to include a wider range of services in future years, potentially increasing its impact on the traditional Medicare program over time.
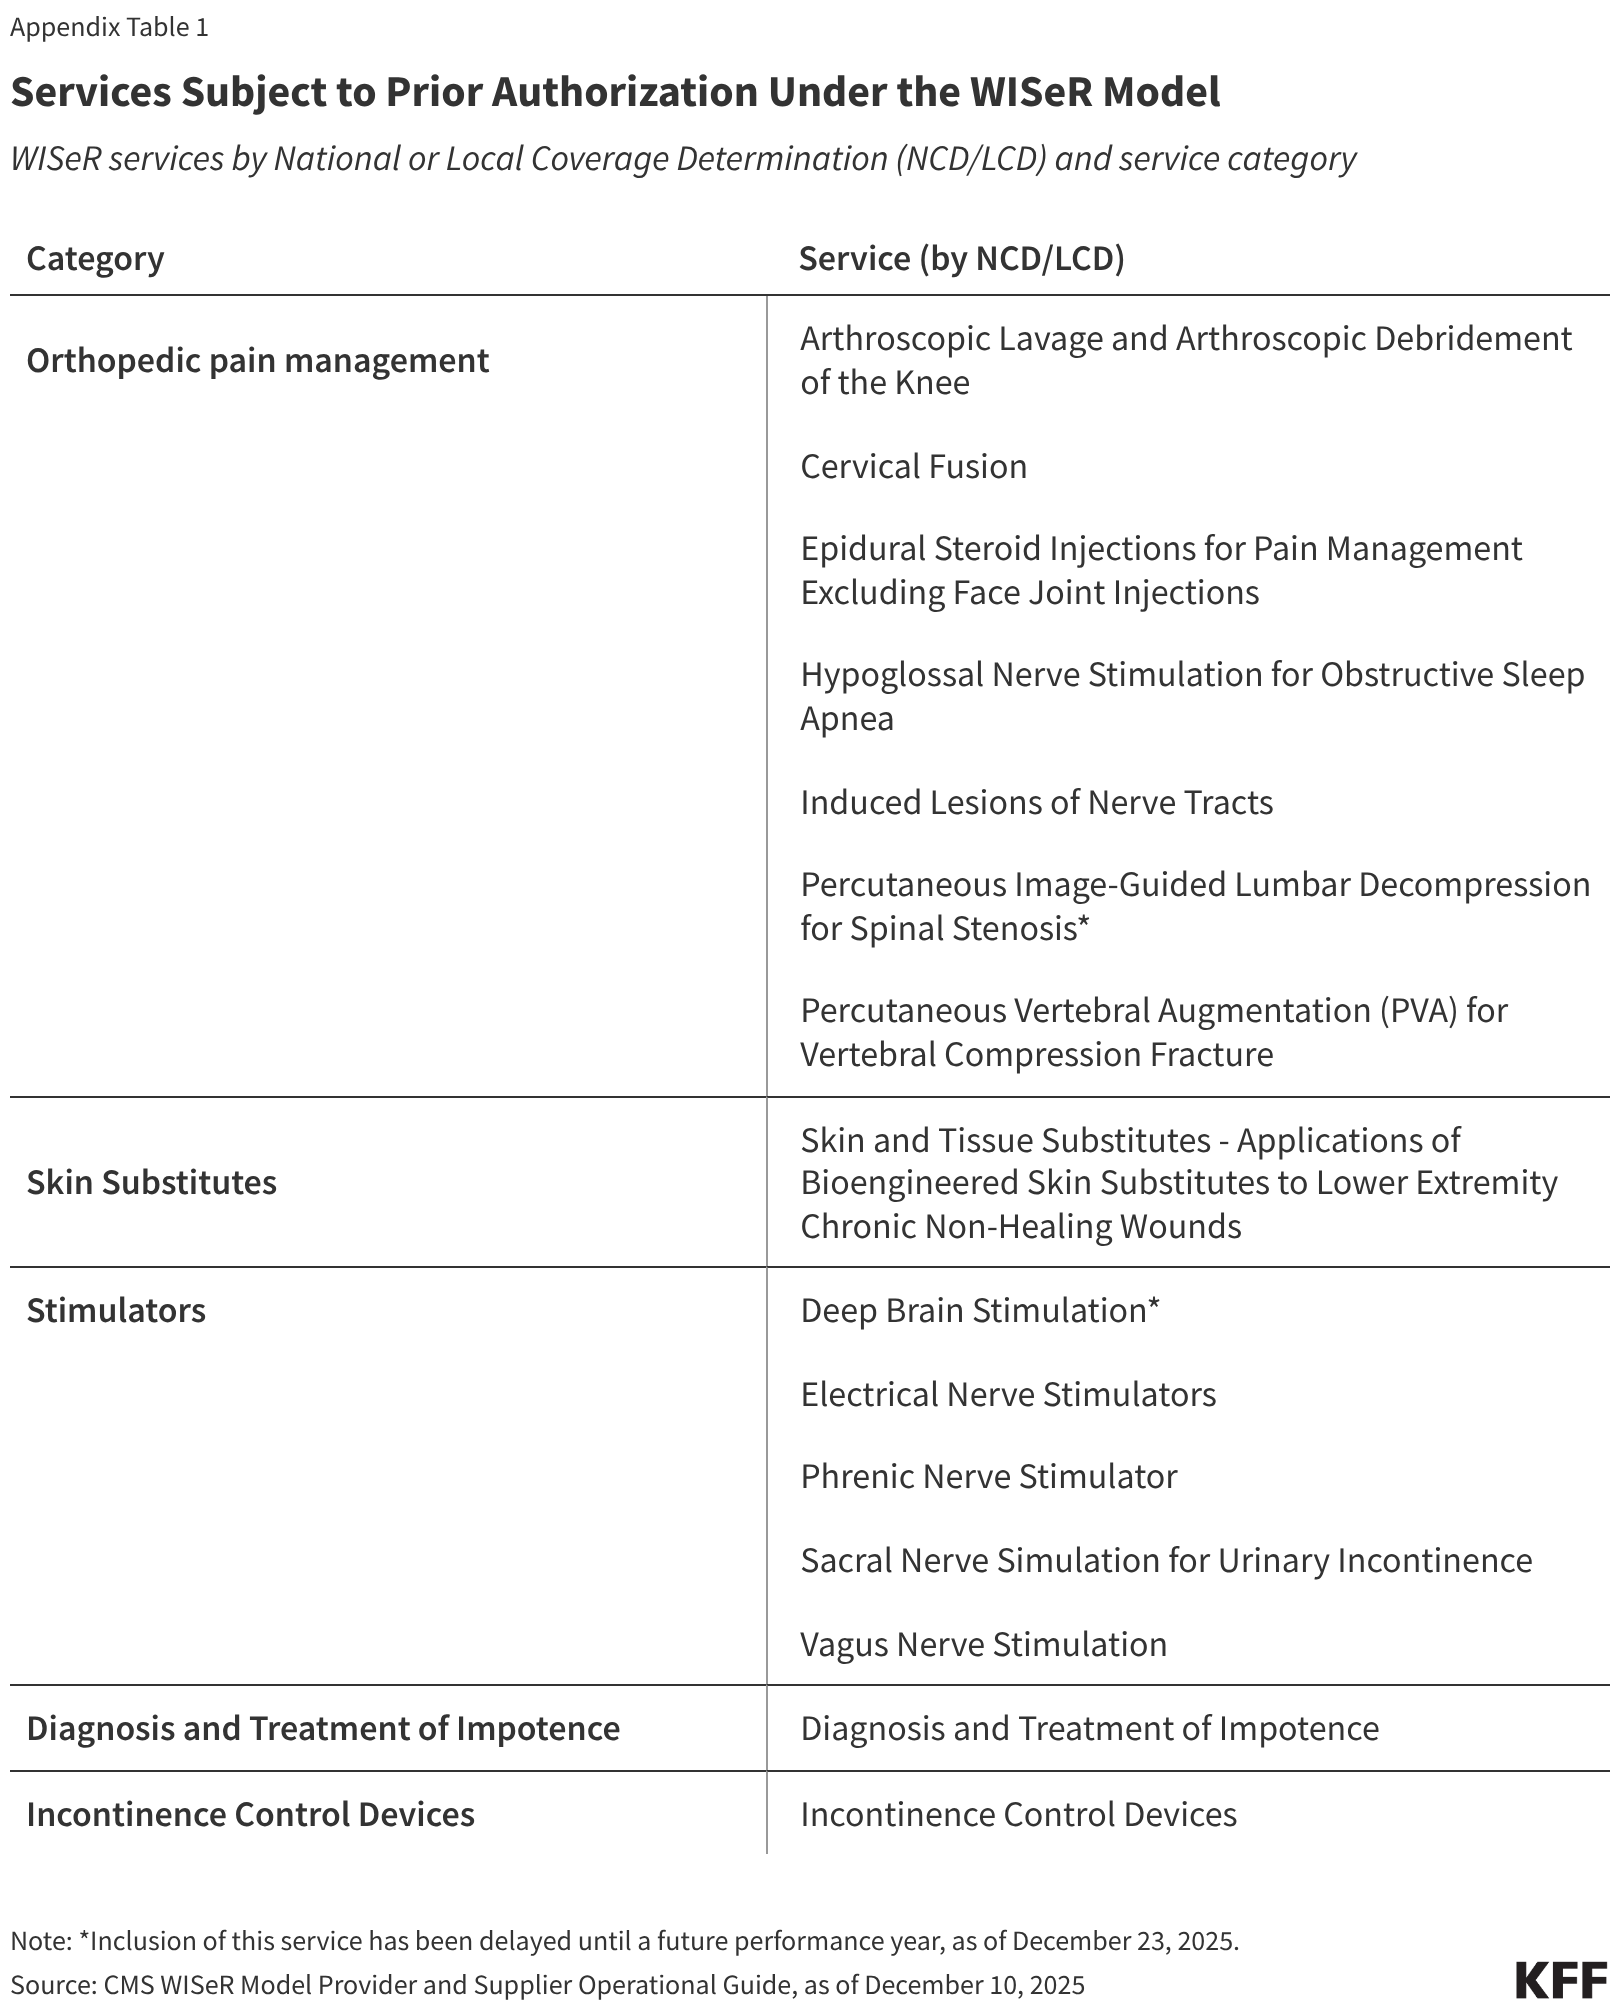
Services selected for prior authorization under the WISeR model in 2026 include skin substitutes (synthetic products used in the treatment of severe or chronic wounds); orthopedic pain management services, such as cervical fusion and epidural steroid injections; electrical nerve stimulator implants; incontinence control devices; and services related to the diagnosis and treatment of impotence (see Appendix for further detail). (Since this analysis was performed, CMS has delayed the inclusion of two services until a future performance year: deep brain stimulation and percutaneous image-guided lumbar decompression for spinal stenosis. Together these two services account for less than 1% of all traditional Medicare spending on services reflected in this analysis from 2019-2024.)
WISeR Services Represent a Small But Growing Share of Part B Spending in Traditional Medicare
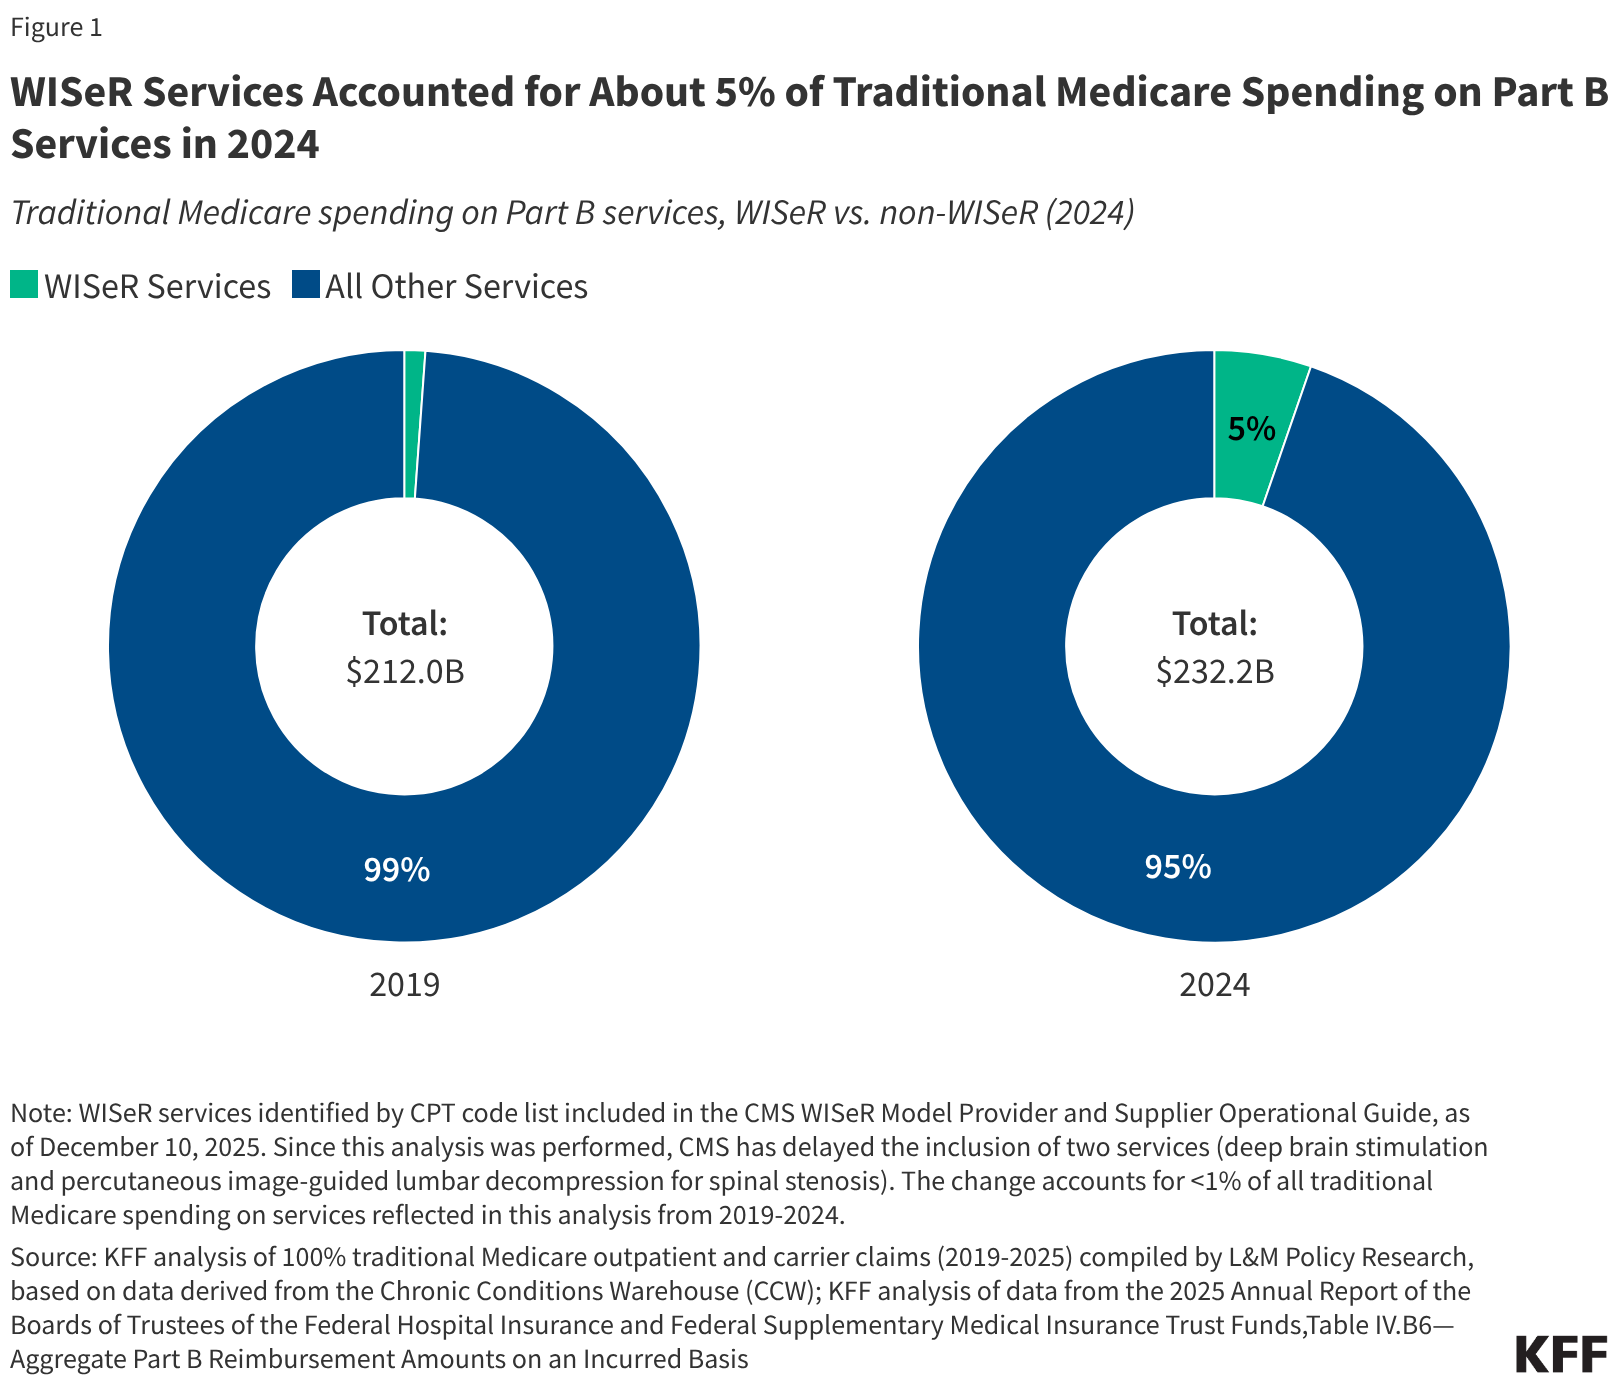
WISeR services account for a small but growing share of Part B spending in traditional Medicare. From 2019 to 2024, spending on these services increased by roughly 400% (from $2.4 billion to $12.3 billion), compared to a 9.5% increase in overall Part B spending in traditional Medicare over these same years (Figure 1). As a result, these services represent a larger share of Part B spending in traditional Medicare in 2024 (5.3%) than in 2019 (1.1%), though still a small fraction of the total in both years. The vast majority of growth in spending on WISeR services during this period was driven by growth in spending on skin substitutes (as discussed below).
Figure 1
https://datawrapper.dwcdn.net/rCTYR/800px.png
WISeR Services Accounted for About 5% of Traditional Medicare Spending on Part B Services in 2024
Traditional Medicare spending on Part B services, WISeR vs. non-WISeR (2024)
Note: WISeR services identified by CPT code list included in the CMS WISeR Model Provider and Supplier Operational Guide, as of December 10, 2025. Since this analysis was performed, CMS has delayed the inclusion of two services (deep brain stimulation and percutaneous image-guided lumbar decompression for spinal stenosis). The change accounts for <1% of all traditional Medicare spending on services reflected in this analysis from 2019-2024.
Source: KFF analysis of 100% traditional Medicare outpatient and carrier claims (2019-2025) compiled by L&M Policy Research, based on data derived from the Chronic Conditions Warehouse (CCW); KFF analysis of data from the 2025 Annual Report of the Boards of Trustees of the Federal Hospital Insurance and Federal Supplementary Medical Insurance Trust Funds,Table IV.B6—Aggregate Part B Reimbursement Amounts on an Incurred BasisGet the dataDownload PNG
Skin Substitutes Accounted for the Vast Majority of WISeR Service Spending in 2024, and of Spending Growth on These Services Since 2019
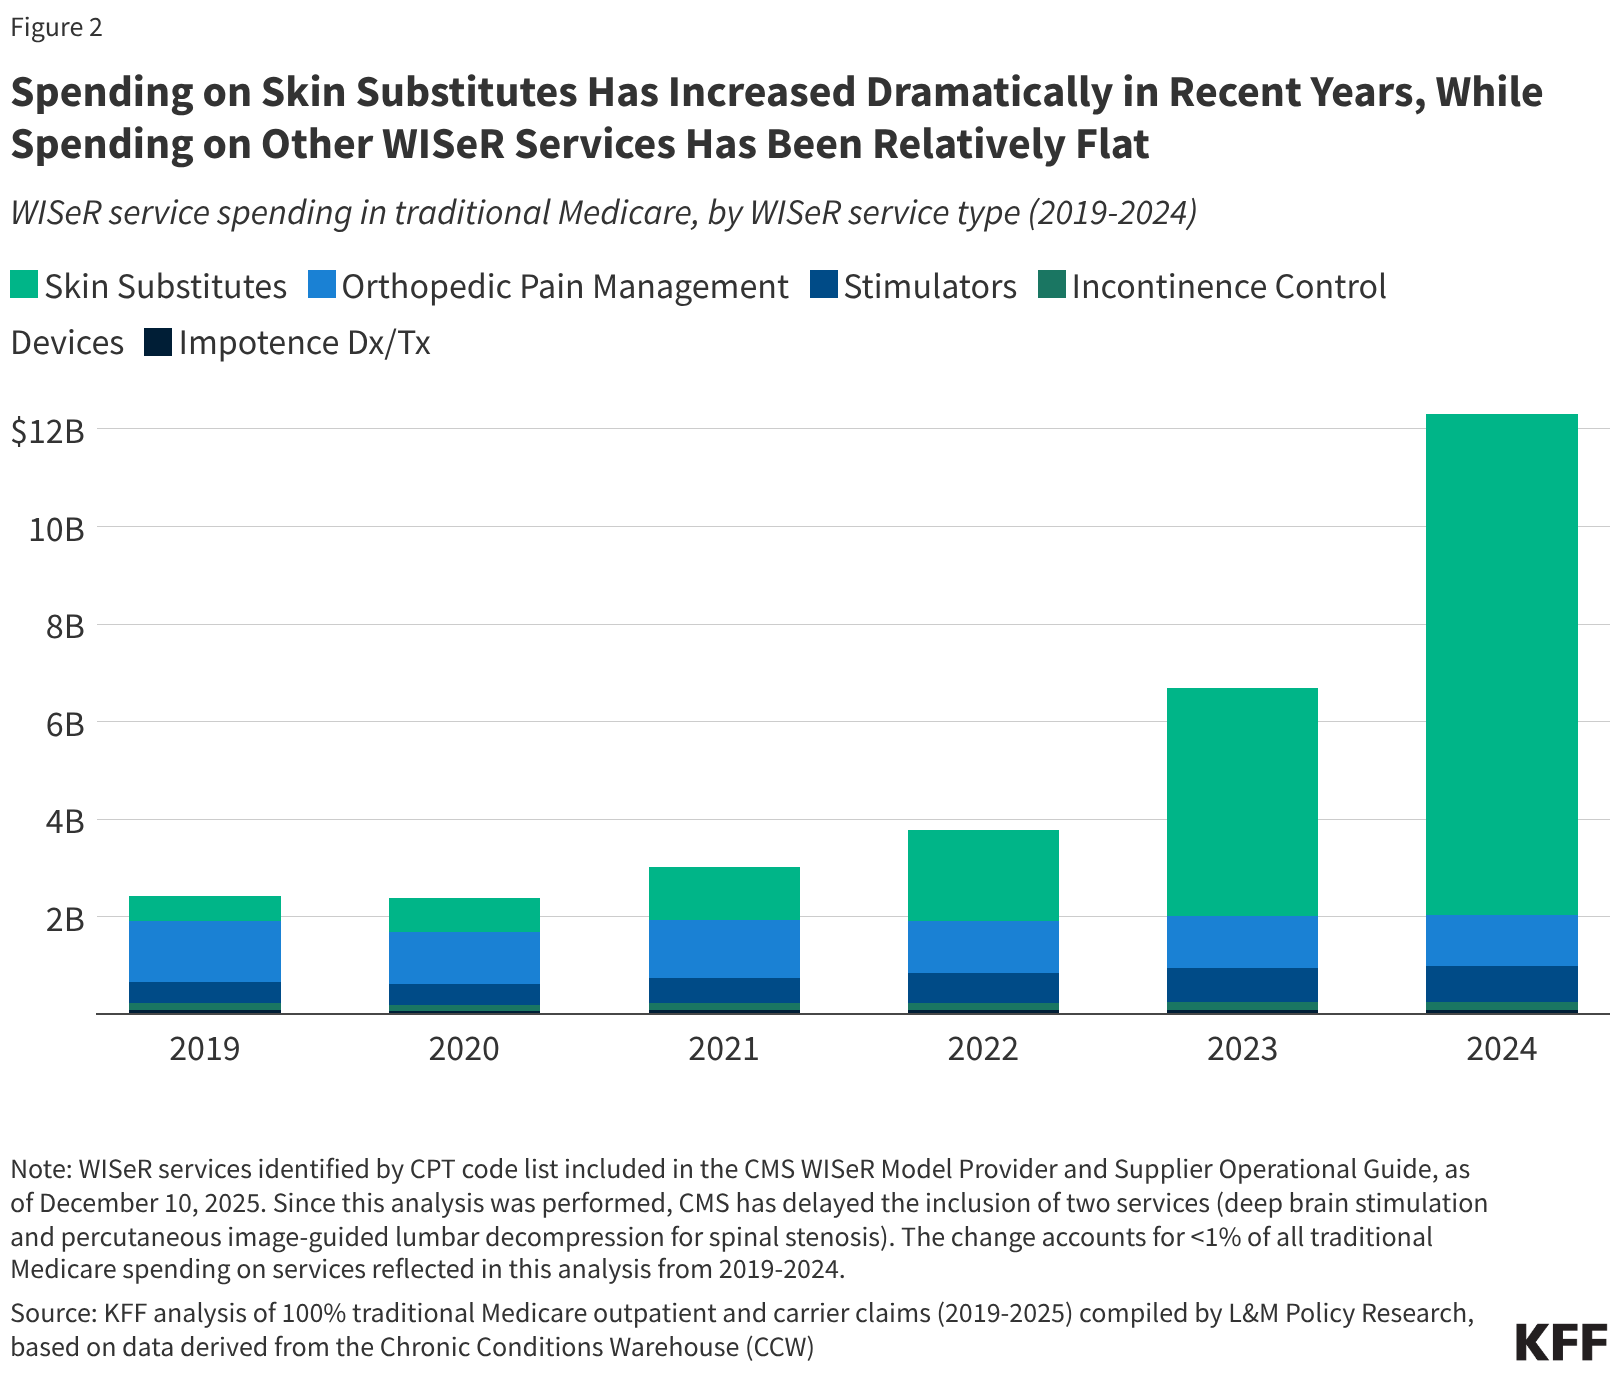
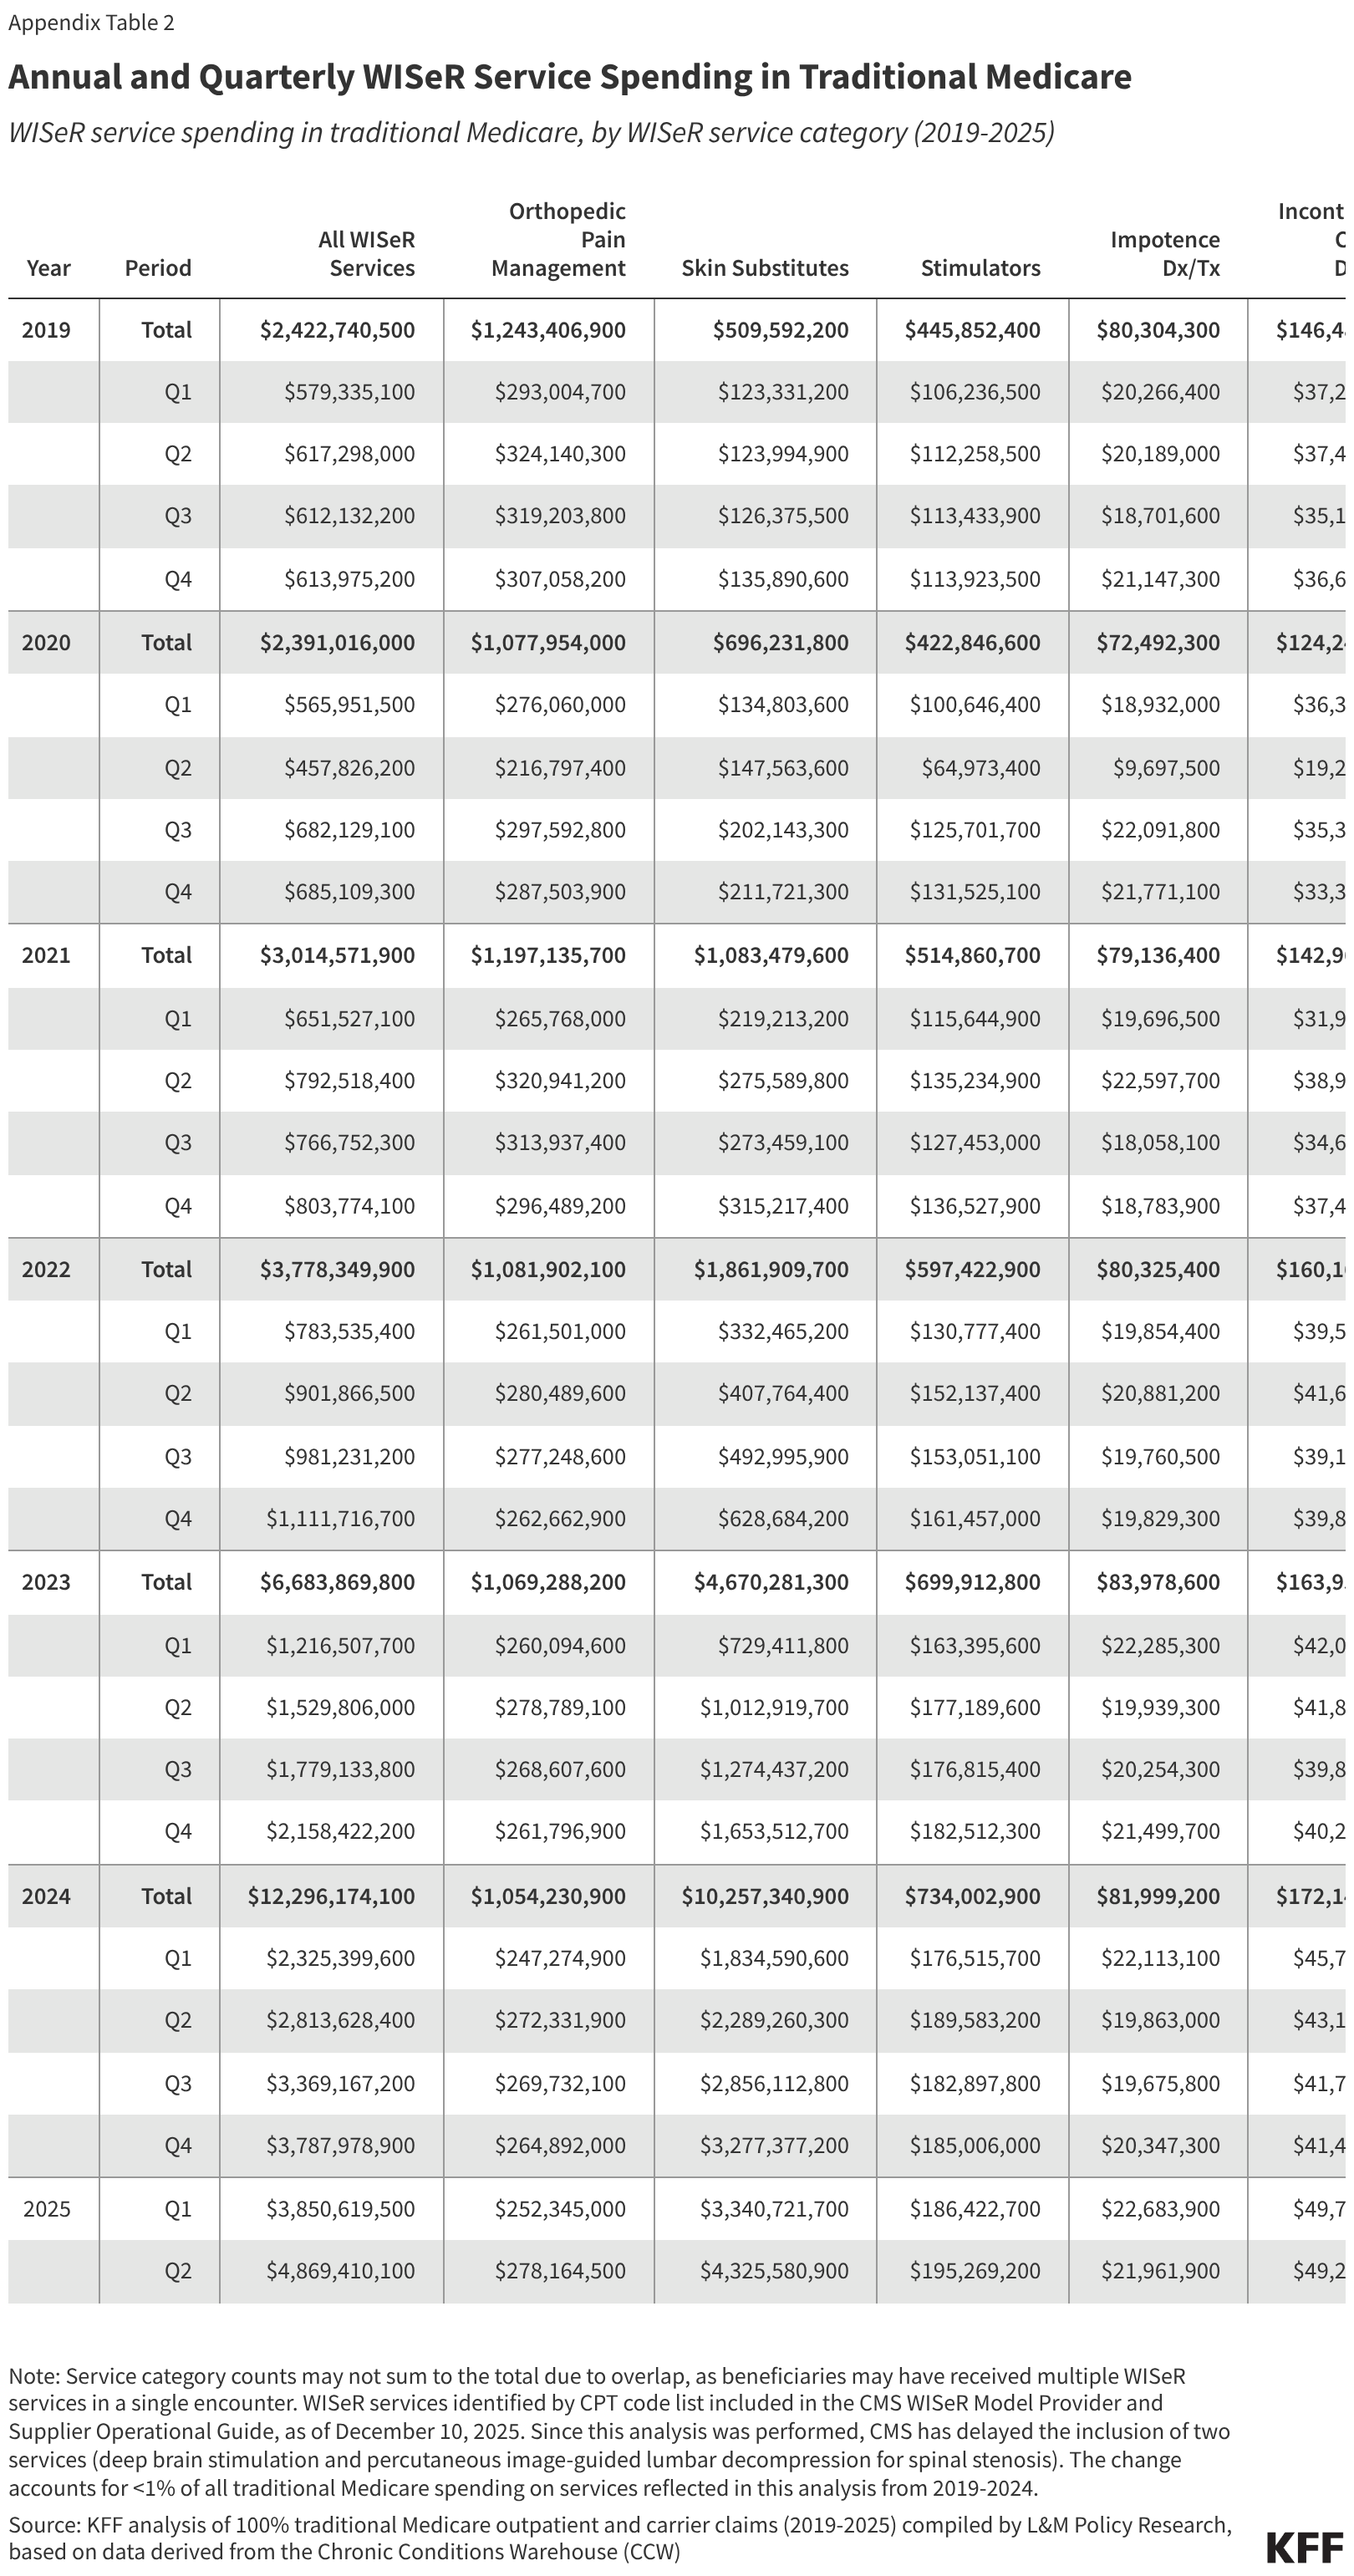
Skin substitutes accounted for the largest share ($10.3 billion or 83.4%) of WISeR service spending in traditional Medicare in 2024 (Figure 2). This represents a nearly 2,000% increase since 2019 ($509.6 million) when skin substitutes accounted for just 21.0% of WISeR service spending in traditional Medicare. In contrast, spending on all other WISeR services combined was just 6.6% higher in 2024 ($2.0 billion) than in 2019 ($1.9 billion), slightly less than the 9.5% increase seen for all Part B spending in traditional Medicare during this period. Spending on skin substitutes continued to accelerate in 2025, and was nearly 3,000% higher in the first six months of 2025 ($7.7 billion) than in the first six months of 2019 ($247.3 million) (Appendix Table 2).
Figure 2
Spending on Skin Substitutes Has Increased Dramatically in Recent Years, While Spending on Other WISeR Services Has Been Relatively Flat
WISeR service spending in traditional Medicare, by WISeR service type (2019-2024)
Skin
Substitutes
Orthopedic
Pain Management
Stimulators
Incontinence
Control Devices
Impotence
Dx/Tx2B4B6B8B10B$12B201920202021202220232024
$80.3M
$146.5M
$445.9M
$1.2B
$509.6M
$72.5M
$124.2M
Note: WISeR services identified by CPT code list included in the CMS WISeR Model Provider and Supplier Operational Guide, as of December 10, 2025. Since this analysis was performed, CMS has delayed the inclusion of two services (deep brain stimulation and percutaneous image-guided lumbar decompression for spinal stenosis). The change accounts for <1% of all traditional Medicare spending on services reflected in this analysis from 2019-2024.
Source: KFF analysis of 100% traditional Medicare outpatient and carrier claims (2019-2025) compiled by L&M Policy Research, based on data derived from the Chronic Conditions Warehouse (CCW)Get the dataDownload PNG
Growth in traditional Medicare spending on skin substitutes has gained attention in recent years, including reports from the Office of the Inspector General (OIG) that raised concerns about unusual billing patterns, lack of adequate pricing information from manufacturers, and several instances of fraud. Prior to 2026, skin substitutes were classified as biologicals for the purpose of Medicare payment. Each product received a unique billing code, and payment rates were generally based on the manufacturer-reported average sales price (ASP) (or list price when ASP data was unavailable), allowing for considerable variation in payment rates across different manufacturers and products.
CMS has since made changes to the way Medicare classifies and pays for these products, reclassifying them as “incident to” supplies reimbursed at a fixed rate. In 2026, most applications of skin substitutes will be reimbursed at a rate of $127.28 per square centimeter, substantially less than the average rate paid for skin substitutes under traditional Medicare in 2024 ($1,470 per square centimeter), a change that CMS estimates will reduce Medicare spending on skin substitutes by nearly 90% in 2026. These changes, which went into effect on January 1, apply nationwide and represent a more direct strategy to control spending on skin substitutes than their inclusion in the WISeR model, which is temporary, has a limited geographic reach, and targets inappropriate use, rather than the price increases that have largely driven the recent increase in spending.
At the same time, new local coverage determinations (LCDs) that would have substantially limited the number of skin substitute products covered by Medicare, were also scheduled to go into effect on January 1, but were withdrawn by CMS in late December. In the absence of these new LCDs, Medicare will cover the same range of skin substitute products in 2026 as it has in past years.
Most of the 1.1 Million Traditional Medicare Beneficiaries Who Received a WISeR Service in 2024 Received Orthopedic Pain Management Services, While Far Fewer Received Skin Substitutes
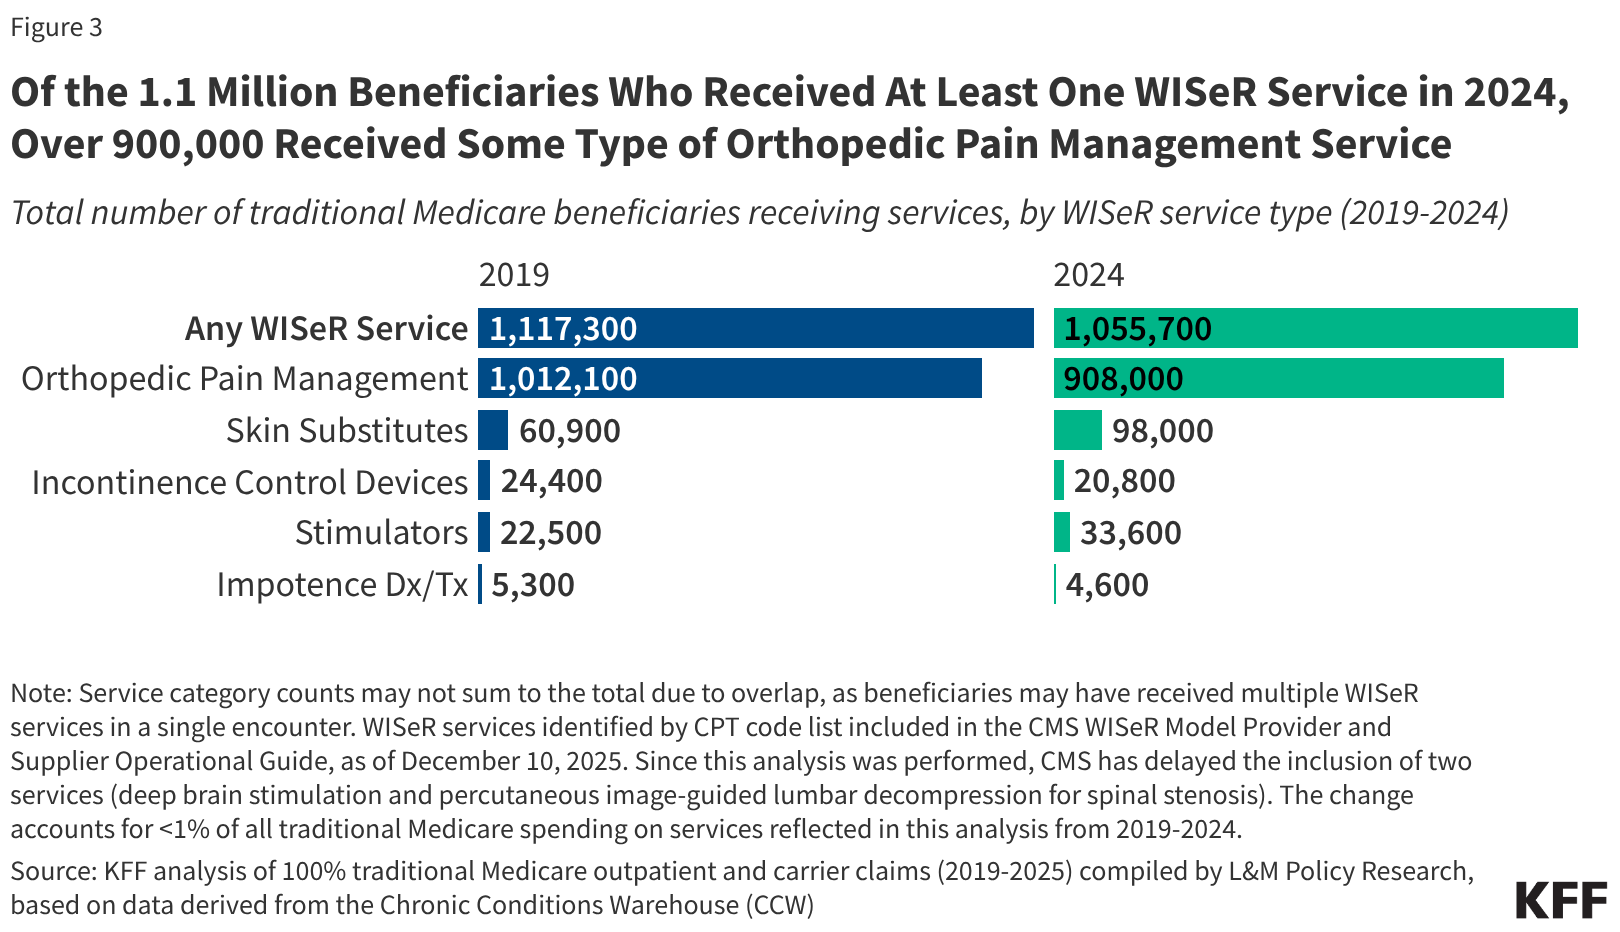
Nearly 1.1 million traditional Medicare beneficiaries nationwide received at least one WISeR service in 2024, 3.2% of all beneficiaries in traditional Medicare that year (Figure 3). A similar share (just over 1.1 million or 3.0%) received at least one WISeR service in 2019 (the total number of beneficiaries in traditional Medicare declined somewhat between 2019 and 2024, from 37.8 million to 33.1 million, due to increasing enrollment in Medicare Advantage).
Figure 3
Of the 1.1 Million Beneficiaries Who Received At Least One WISeR Service in 2024, Over 900,000 Received Some Type of Orthopedic Pain Management Service
Total number of traditional Medicare beneficiaries receiving services, by WISeR service type (2019-2024)
Y
Note: Service category counts may not sum to the total due to overlap, as beneficiaries may have received multiple WISeR services in a single encounter. WISeR services identified by CPT code list included in the CMS WISeR Model Provider and Supplier Operational Guide, as of December 10, 2025. Since this analysis was performed, CMS has delayed the inclusion of two services (deep brain stimulation and percutaneous image-guided lumbar decompression for spinal stenosis). The change accounts for <1% of all traditional Medicare spending on services reflected in this analysis from 2019-2024.
Source: KFF analysis of 100% traditional Medicare outpatient and carrier claims (2019-2025) compiled by L&M Policy Research, based on data derived from the Chronic Conditions Warehouse (CCW)Get the dataDownload PNG
Roughly 908,000 of the 1.1 million beneficiaries who received at least one WISeR service nationwide in 2024 (86.0% of the total) received some type of orthopedic pain management service, slightly fewer than the number of beneficiaries who received this type of service in 2019 (1.0 million or 90.6% of all WISeR service users that year). Orthopedic pain management services subject to prior authorization under the WISeR model include epidural steroid injections, cervical fusion, lavage and debridement of the knee, and other procedures used to treat pain in conditions such as osteoarthritis, osteoporosis, and spinal stenosis (see Appendix for further detail).
In comparison, just 98,000 of the 1.1 million beneficiaries who received at least one WISeR service in 2024 were treated with skin substitutes (9.3% of the total), up from roughly 60,900 in 2019 (5.5% of all WISeR service users that year). Applications of skin substitutes subject to prior authorization under the WISeR model include treatment of wounds on the extremities, including chronic non-healing wounds such as bedsores and diabetic foot ulcers.
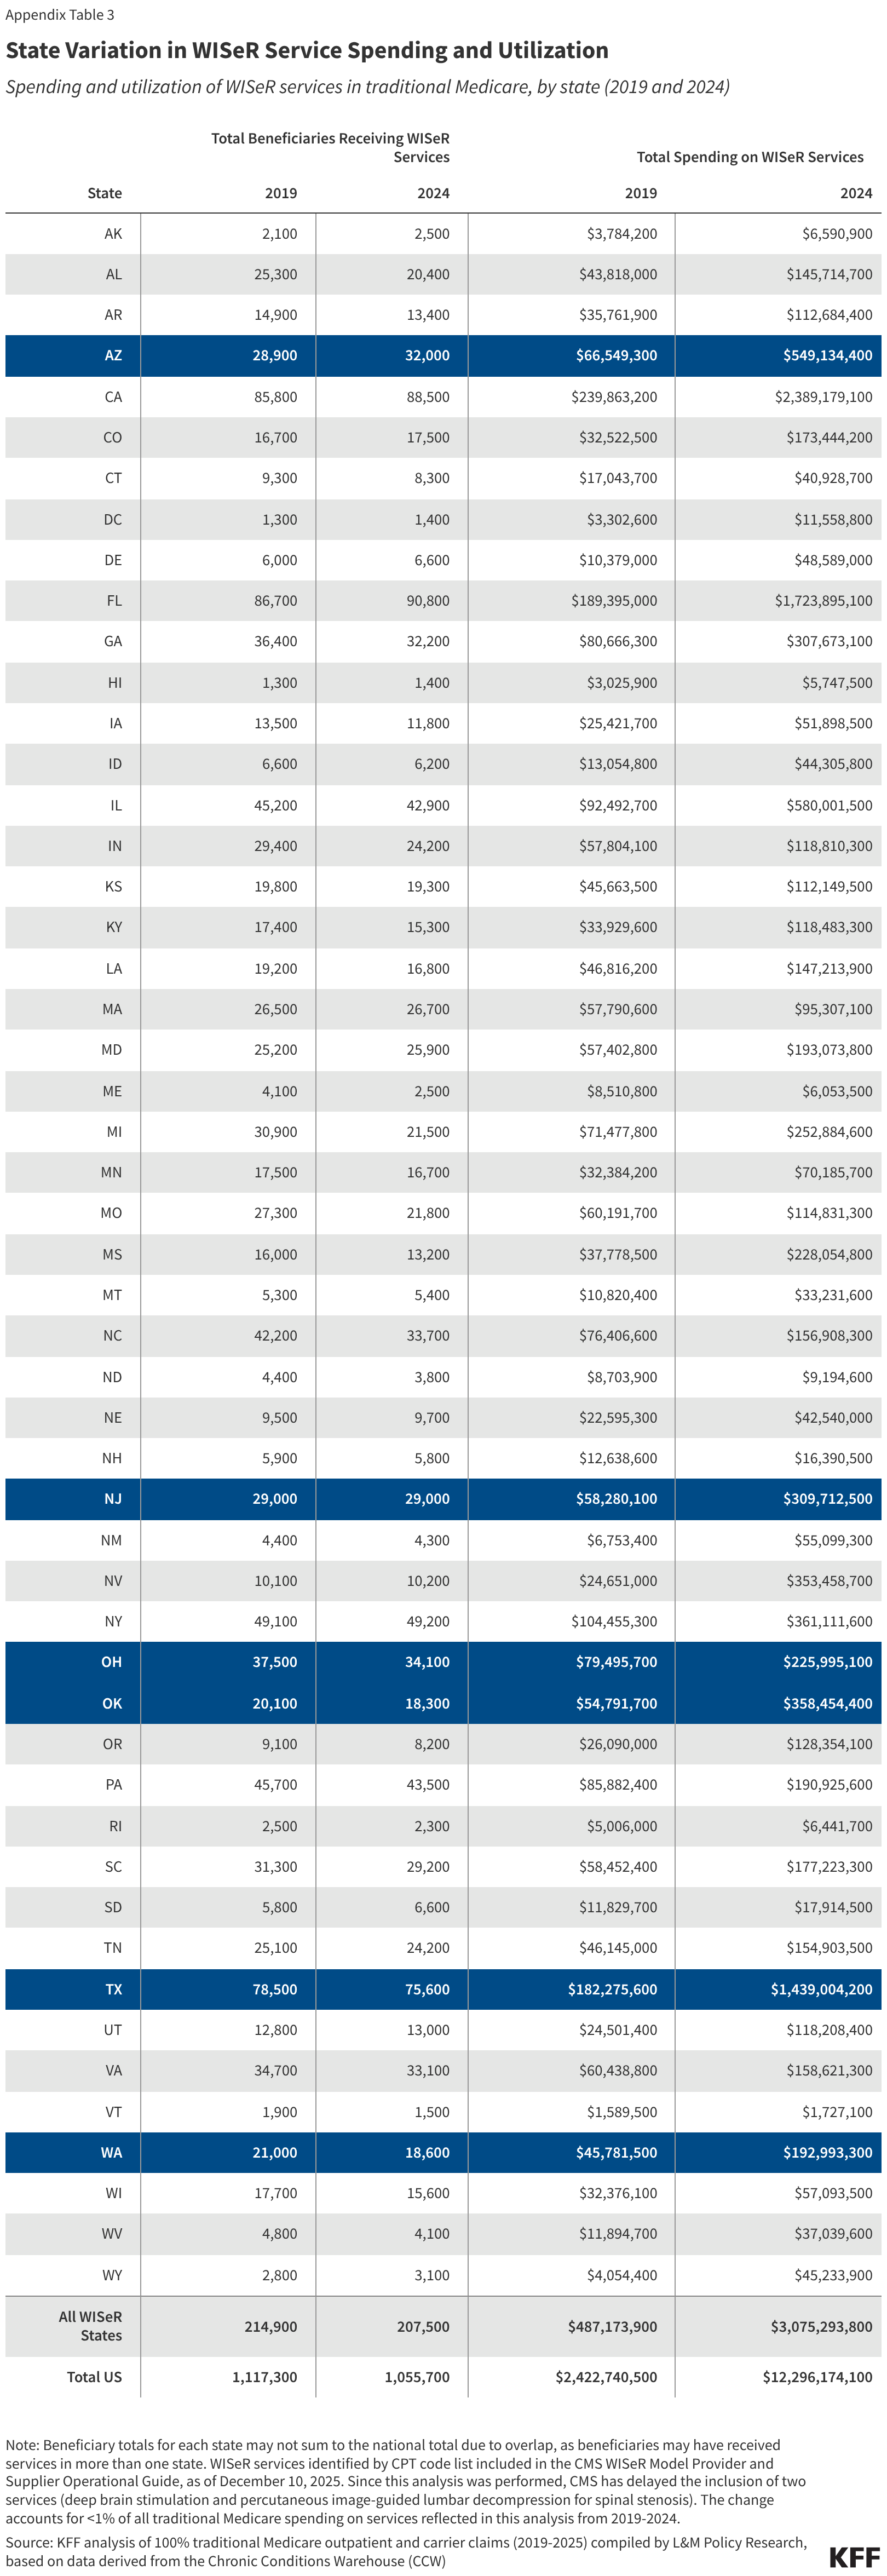
The number of traditional Medicare beneficiaries likely to be impacted by the new prior authorization requirements is small. Of the 1.1 million traditional Medicare beneficiaries who received at least one WISeR service in 2024, roughly 207,500 (19.7%) were located in one of the six WISeR model states (Appendix Table 3). This is similar to the share of all traditional Medicare beneficiaries (6.4 million or 19.3%) who resided in one of these six states that same year. Based on the number of beneficiaries who used WISeR services in 2024, a majority of those who will be subject to the new prior authorization requirements will encounter them in the context of services other than skin substitutes, which could limit the savings that can be achieved in the model’s first year.
Growth in Skin Substitute Spending Was Driven By Steep Growth in Price Per Service
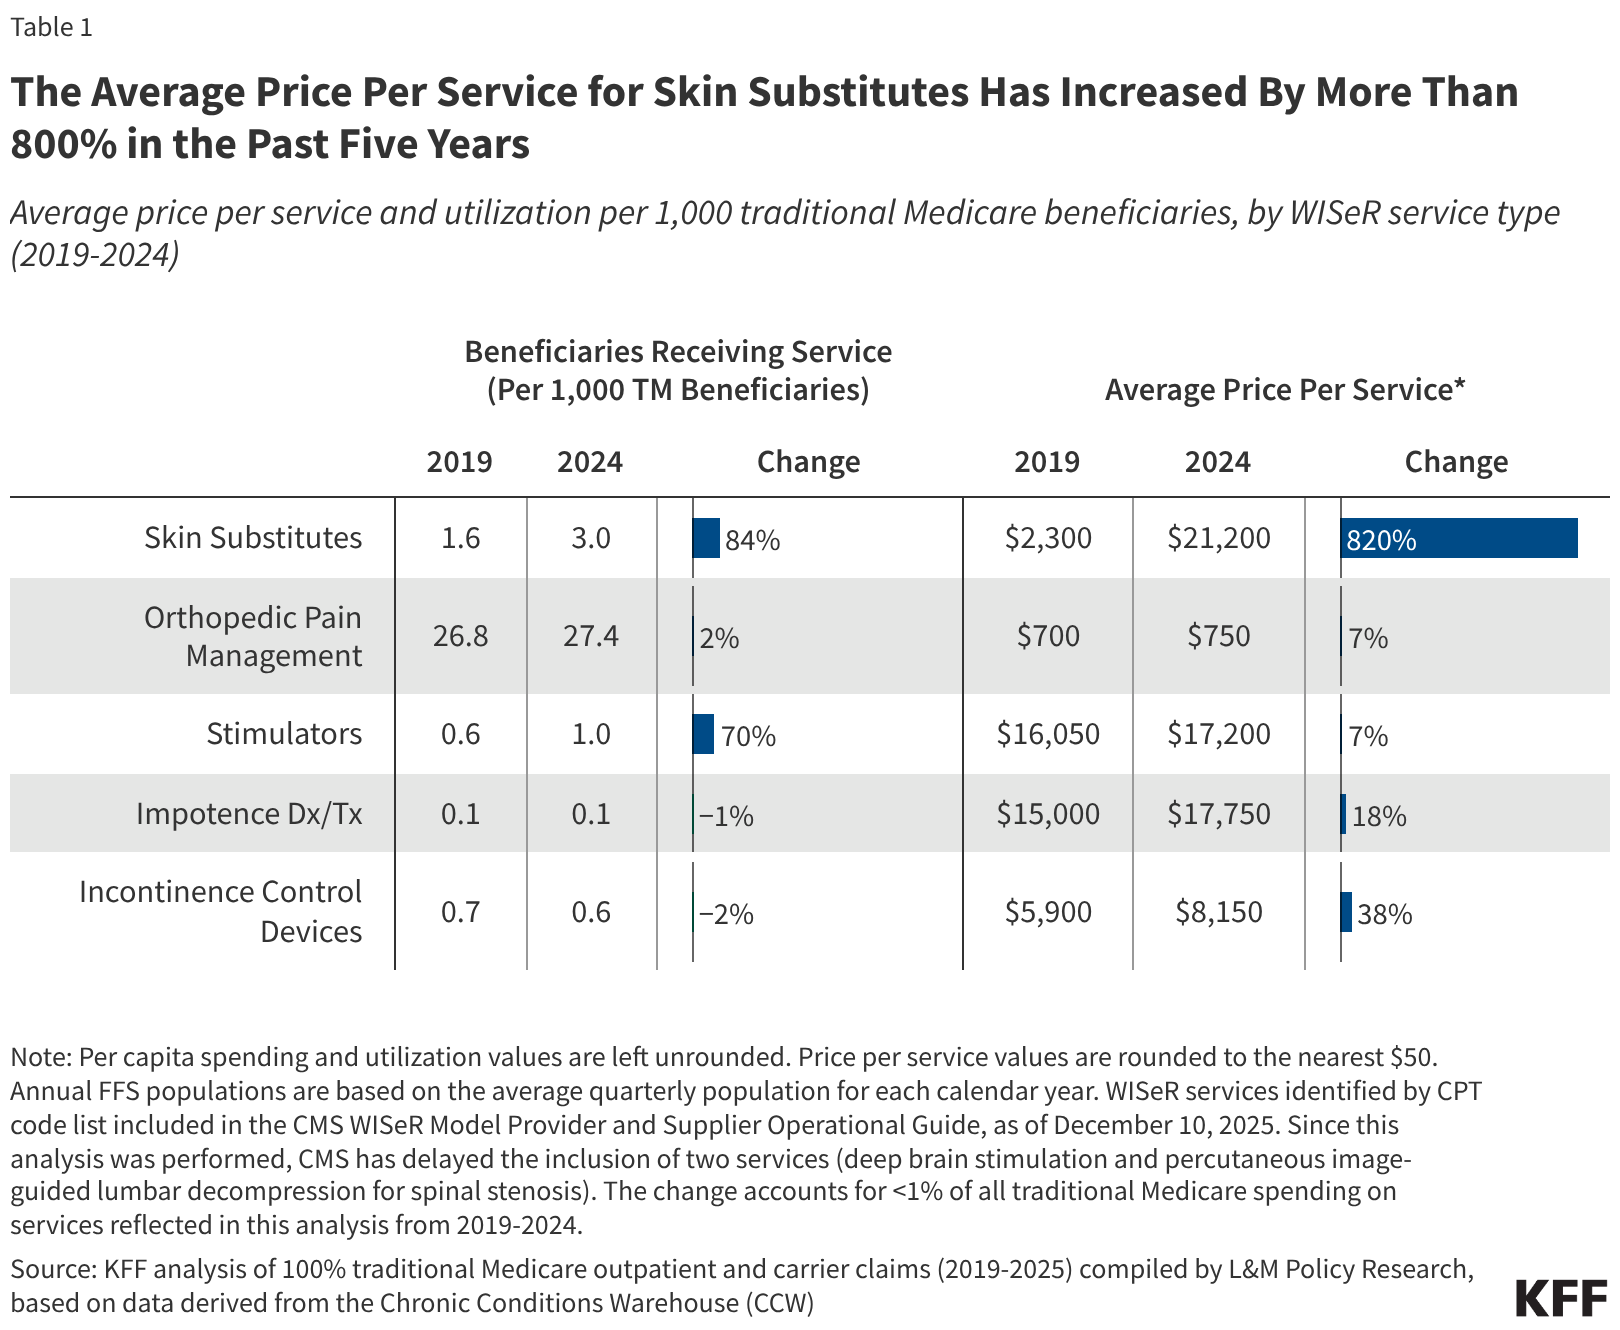
Skin substitutes were the most expensive category of WISeR services in 2024, with an average price per service of $21,200, followed by diagnosis and treatment of impotence ($17,750) and stimulator services ($17,200) (Table 1). This is largely due to steep growth in the average price per service for skin substitutes, which increased by 820% (up from $2,300) from 2019 to 2024. In comparison, growth in the average price per service for other WISeR services was relatively modest during this period, with the second highest growth seen for incontinence control devices (38%), followed by diagnosis and treatment of impotence (18%), stimulator services (7%), and orthopedic pain management (7%). (For the purposes of this analysis, price per service refers to the average sum of all Medicare payments associated with the encounter at which the WISeR service was provided. See Methods for further detail.)
Table 1
The Average Price Per Service for Skin Substitutes Has Increased By More Than 800% in the Past Five Years
Average price per service and utilization per 1,000 traditional Medicare beneficiaries, by WISeR service type (2019-2024)
| Beneficiaries Receiving Service (Per 1,000 TM Beneficiaries) | Average Price Per Service* | |||||
|---|---|---|---|---|---|---|
| 2019 | 2024 | Change | 2019 | 2024 | Change | |
| Skin Substitutes | 1.6 | 3.0 | 84%84%84% | $2,300 | $21,200 | 820%820%820% |
| Orthopedic Pain Management | 26.8 | 27.4 | 2%2%2% | $700 | $750 | 7%7%7% |
| Stimulators | 0.6 | 1.0 | 70%70%70% | $16,050 | $17,200 | 7%7%7% |
| Impotence Dx/Tx | 0.1 | 0.1 | −1%−1%−1% | $15,000 | $17,750 | 18%18%18% |
| Incontinence Control Devices | 0.7 | 0.6 | −2%−2%−2% | $5,900 | $8,150 | 38%38%38% |
Note: Per capita spending and utilization values are left unrounded. Price per service values are rounded to the nearest $50. Annual FFS populations are based on the average quarterly population for each calendar year. WISeR services identified by CPT code list included in the CMS WISeR Model Provider and Supplier Operational Guide, as of December 10, 2025. Since this analysis was performed, CMS has delayed the inclusion of two services (deep brain stimulation and percutaneous image-guided lumbar decompression for spinal stenosis). The change accounts for <1% of all traditional Medicare spending on services reflected in this analysis from 2019-2024.
Source: KFF analysis of 100% traditional Medicare outpatient and carrier claims (2019-2025) compiled by L&M Policy Research, based on data derived from the Chronic Conditions Warehouse (CCW)Get the dataDownload PNG
Utilization of skin substitutes increased to a lesser extent (84%) during this period, with 3.0 of every 1,000 beneficiaries in traditional Medicare in 2024 receiving skin substitutes, compared to 1.6 in 2019. Changes in utilization were modest or negligible for other categories of WISeR services as well, ranging from stimulator services (70%) to incontinence control devices (-2%). These results indicate that rising prices, more than increases in utilization, are primarily responsible for the increase in traditional Medicare spending on skin substitutes in recent years.
Per Capita Spending and Spending Growth on WISeR Services Varied Considerably Among WISeR States
According to CMS, the six states selected for participation in the WISeR model were chosen based on a range of criteria such as geographic diversity, service volume, ease of comparison between WISeR and non-WISeR states overseen by the same Medicare Administrative Contractor (MAC), and other factors.
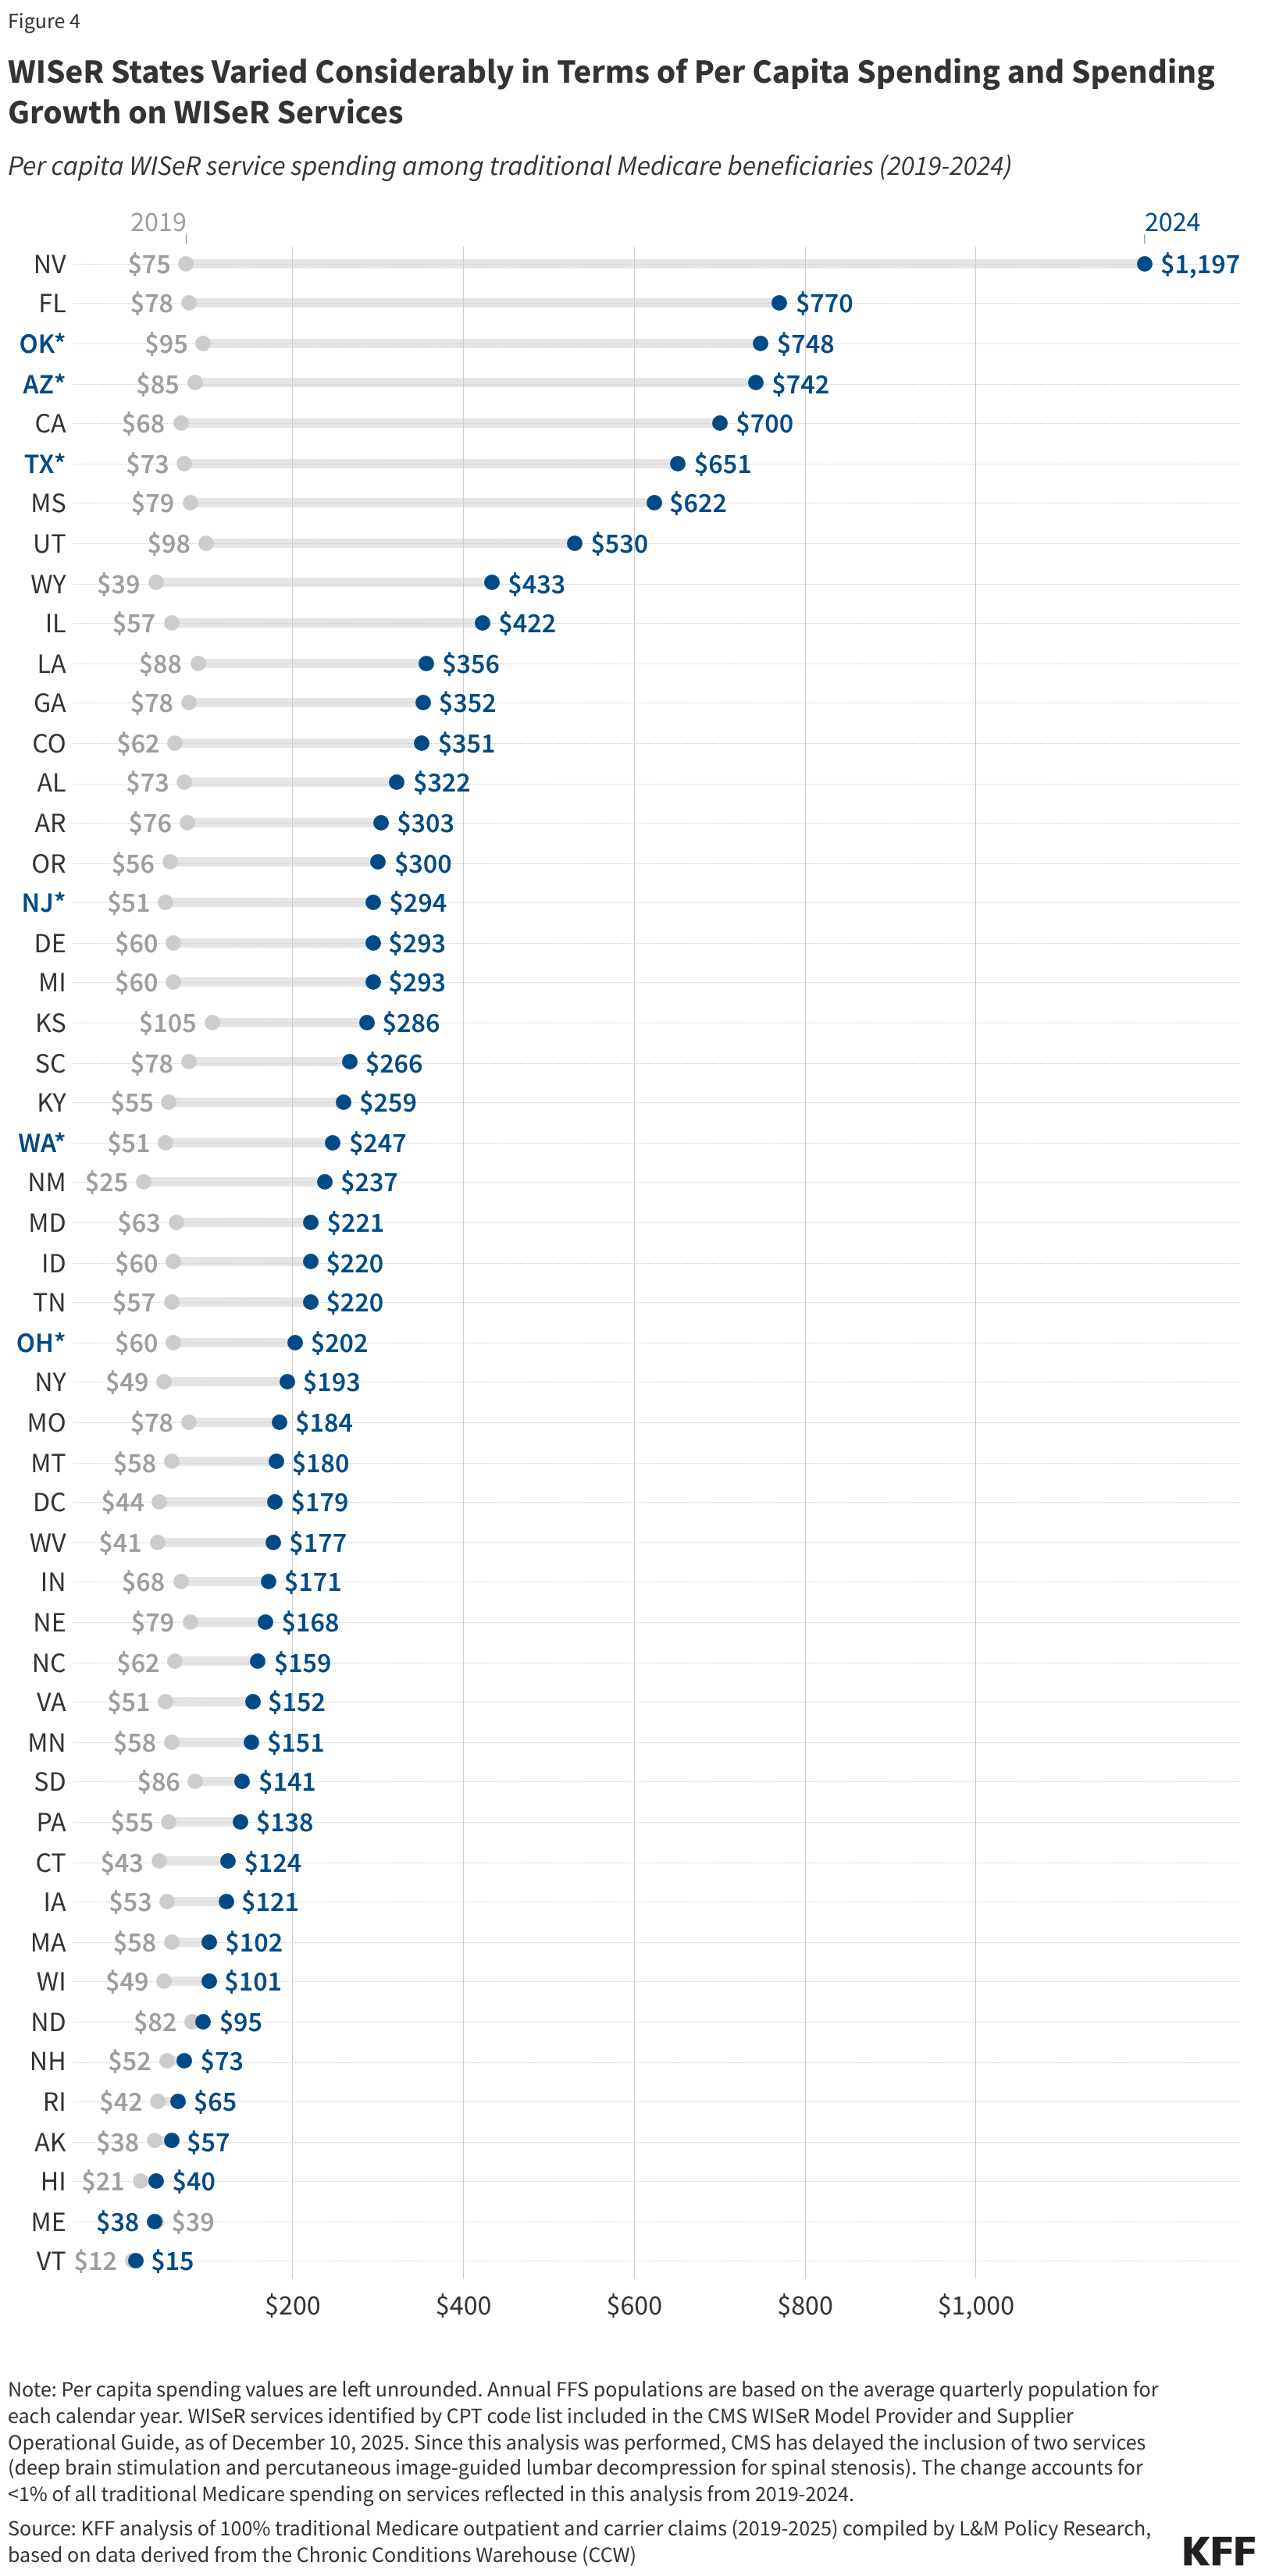
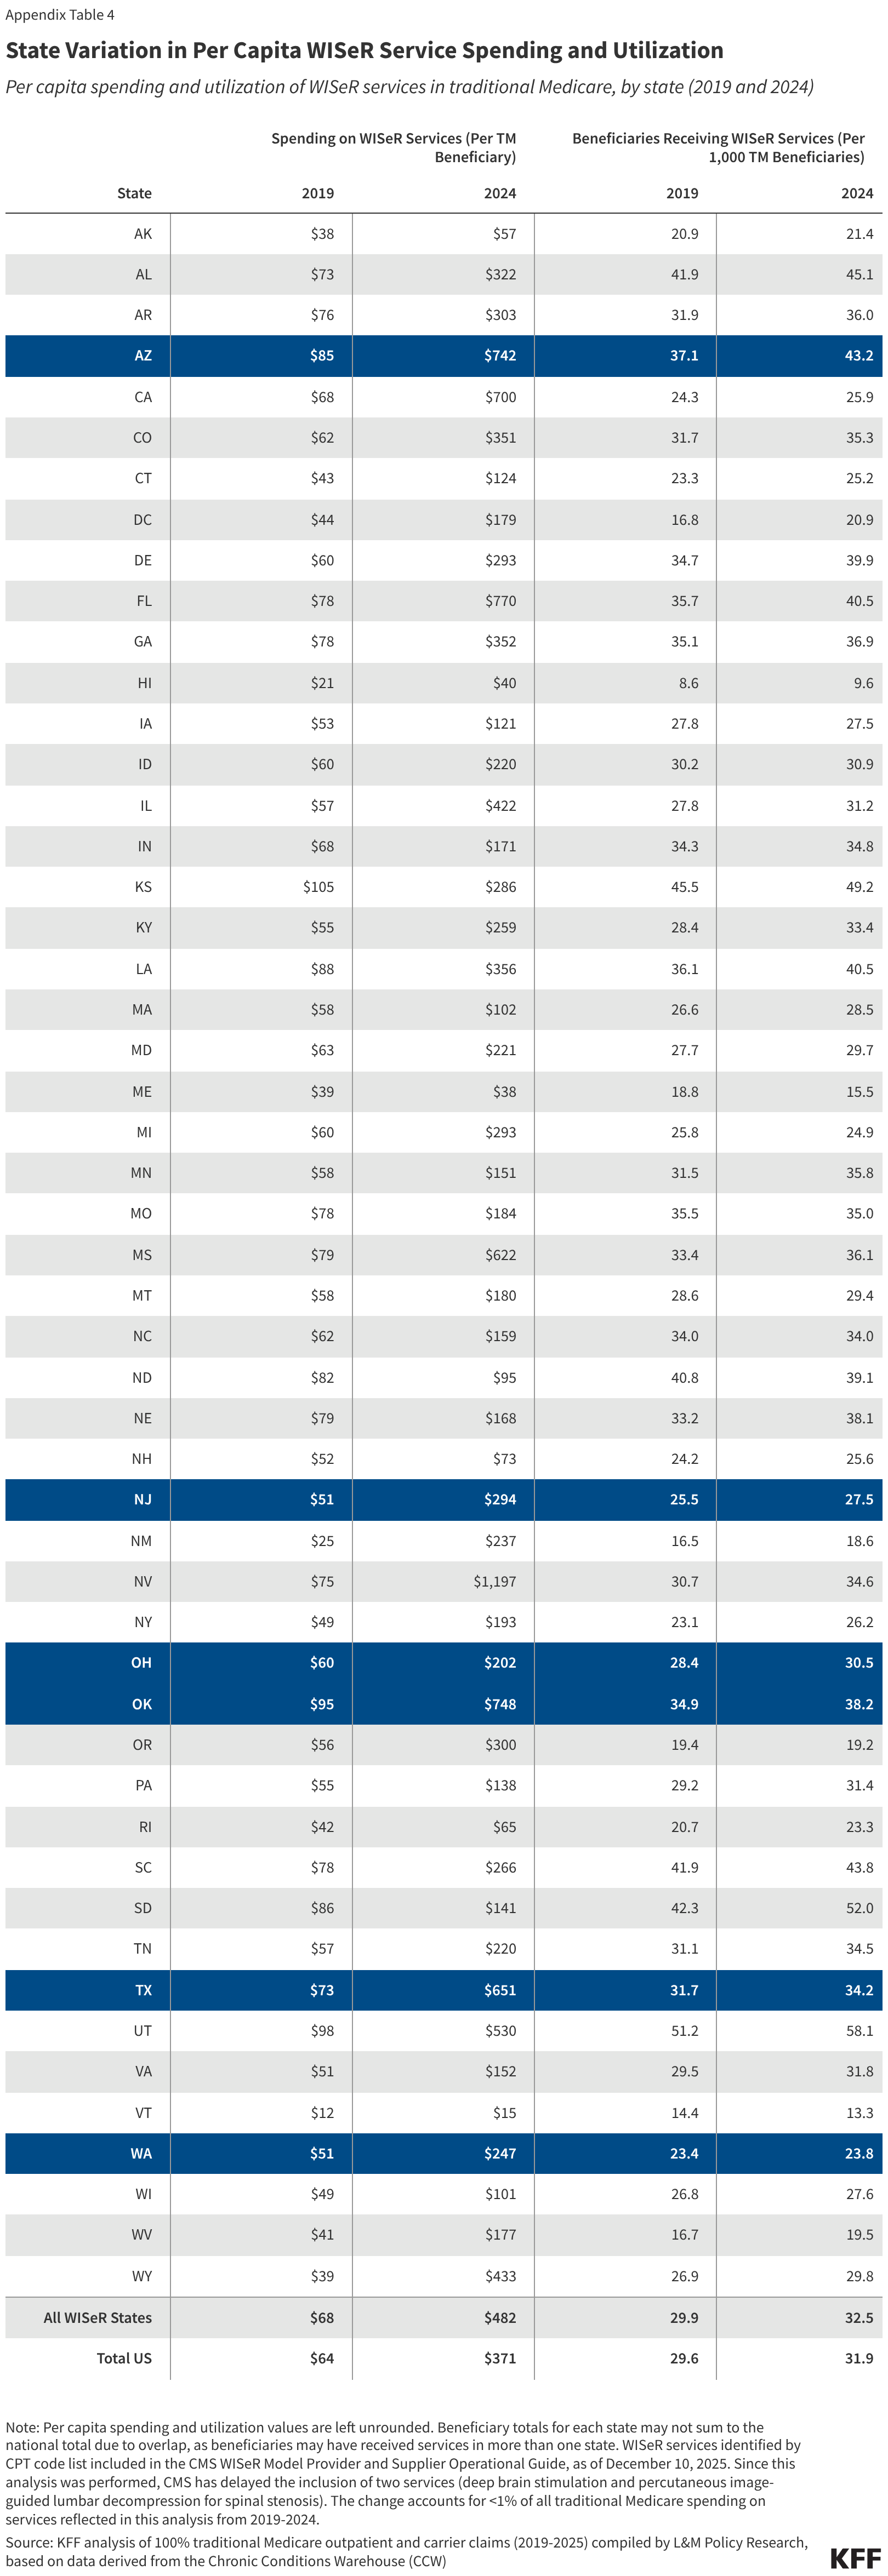
Per capita spending on WISeR services in traditional Medicare varied considerably among the six WISeR model states in 2024 (Figure 4). This ranged from $202 per traditional Medicare beneficiary in Ohio to $748 per traditional Medicare beneficiary in Oklahoma (relative to $371 per traditional Medicare beneficiary nationwide). A similar pattern was true for spending growth from 2019 to 2024.
Figure 4
WISeR States Varied Considerably in Terms of Per Capita Spending and Spending Growth on WISeR Services
Per capita WISeR service spending among traditional Medicare beneficiaries (2019-2024)$200$400$600$800$1,000
N
Note: Per capita spending values are left unrounded. Annual FFS populations are based on the average quarterly population for each calendar year. WISeR services identified by CPT code list included in the CMS WISeR Model Provider and Supplier Operational Guide, as of December 10, 2025. Since this analysis was performed, CMS has delayed the inclusion of two services (deep brain stimulation and percutaneous image-guided lumbar decompression for spinal stenosis). The change accounts for <1% of all traditional Medicare spending on services reflected in this analysis from 2019-2024.
Source: KFF analysis of 100% traditional Medicare outpatient and carrier claims (2019-2025) compiled by L&M Policy Research, based on data derived from the Chronic Conditions Warehouse (CCW)Get the dataDownload PNG
The six WISeR model states also varied in terms of per capita utilization of WISeR services (Appendix Table 4). In 2024, per capita utilization of WISeR services in WISeR states ranged from 24 of every 1,000 traditional Medicare beneficiaries in Washington to 43 of every 1,000 traditional Medicare beneficiaries in Arizona (compared to 32 of every 1,000 traditional Medicare beneficiaries nationwide).
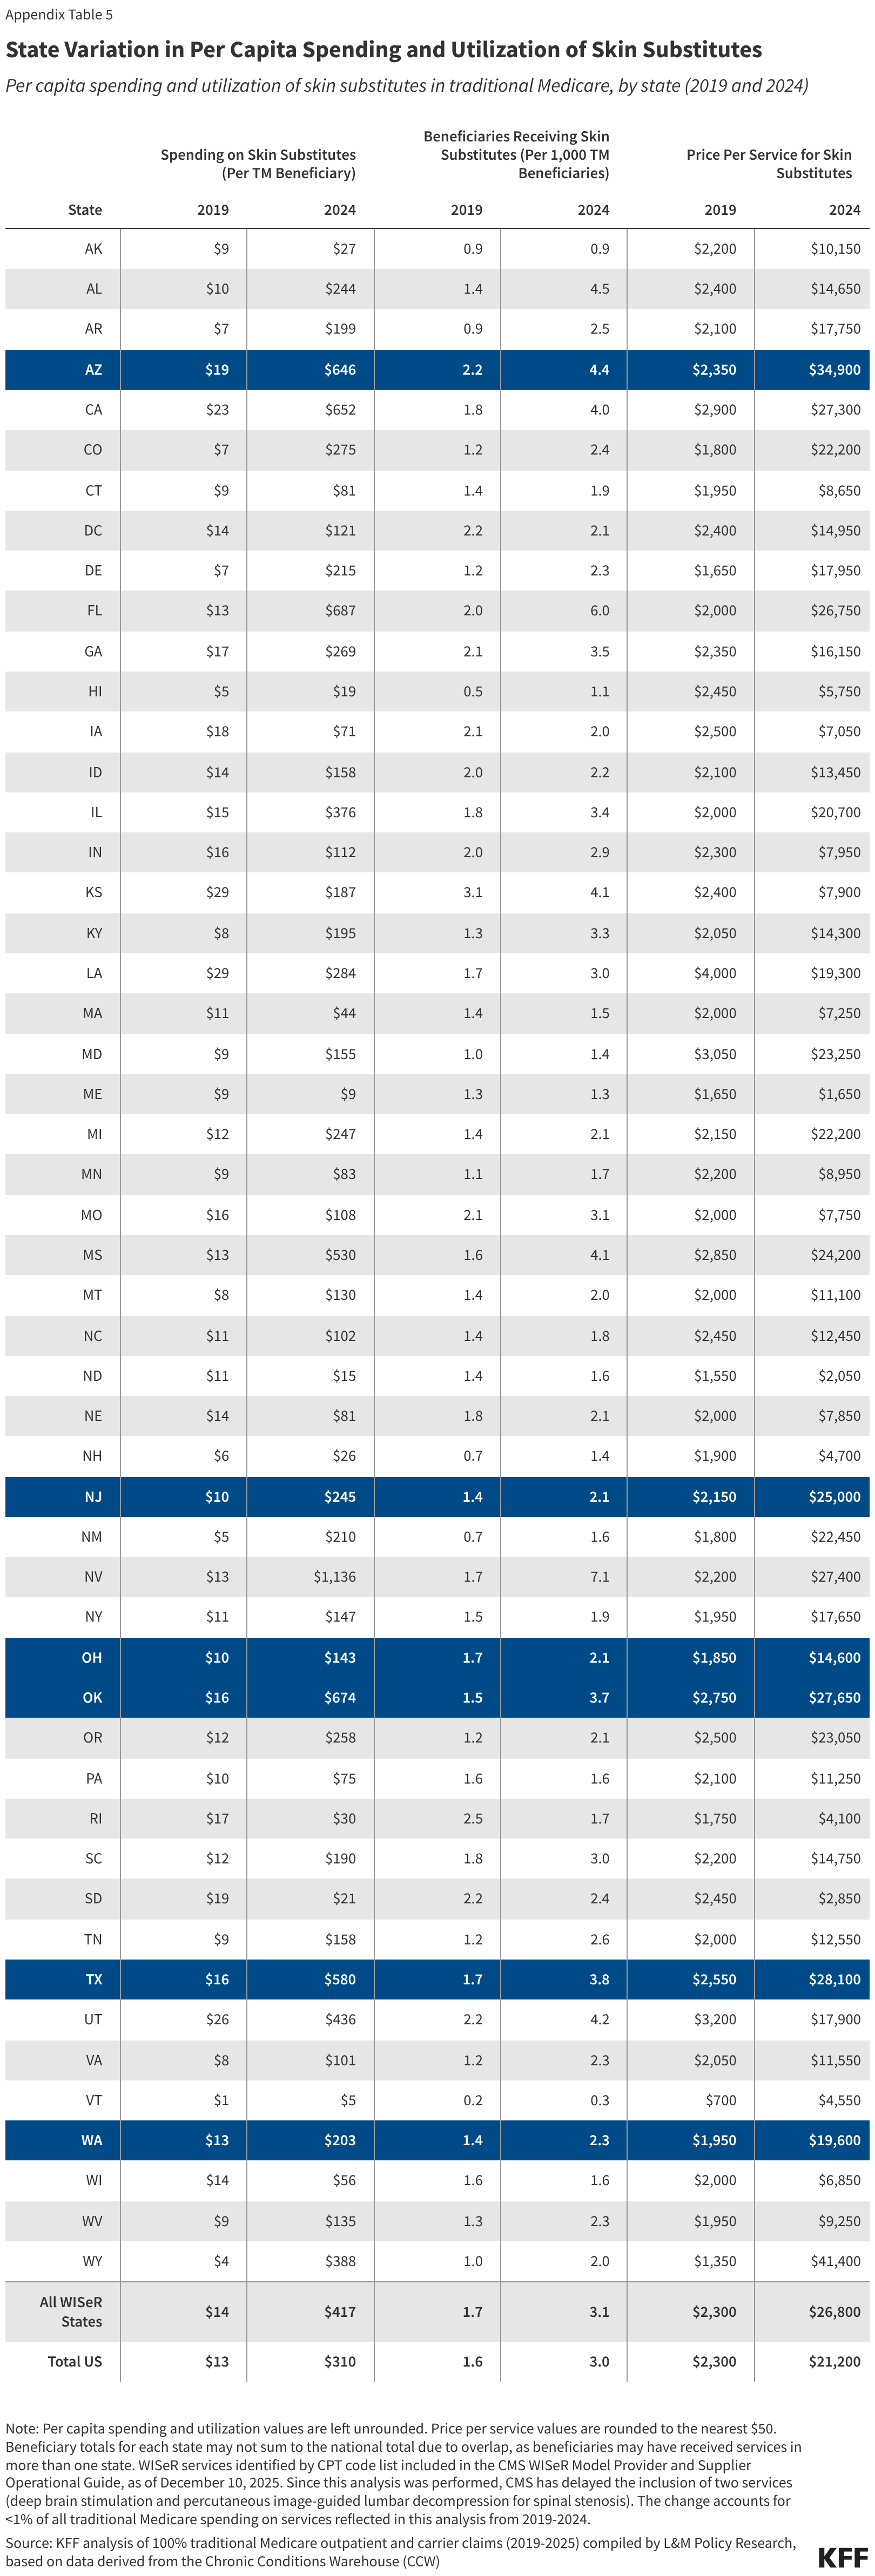
Among the six WISeR model states in 2024, much of the variation in per capita spending on WISeR services was accounted for by differences in per capita spending on skin substitutes, which ranged from $143 per traditional Medicare beneficiary in Ohio to $674 per traditional Medicare beneficiary in Oklahoma (Appendix Table 5). States with higher per capita spending on skin substitutes differed from lower spenders both in terms of per capita utilization of skin substitutes (which ranged from 2.1 to 4.4 of every 1,000 beneficiaries in the state), and in terms of average price per service for skin substitutes (which ranged from $14,600 to $34,900).
Looking to the Future: Key Questions
As the WISeR model moves into its first year of operation, several questions remain about its potential impact on traditional Medicare beneficiaries, health care providers, and spending. These include: how successful the model will be at reducing inappropriate or wasteful service use and spending; whether adequate safeguards are in place to protect beneficiaries from delays and denials of needed health services; how easy (or burdensome) it will be for providers to navigate the new requirements in model states; how effectively CMS will ensure that coverage decisions from health technology vendors are consistent with medical best practices and Medicare coverage criteria; and how CMS will evaluate the model’s success, particularly when determining whether to expand prior authorization requirements to additional services in future years.
CMS has stated that health technology vendors will be required to seek a second opinion from a human clinician before denying prior authorization requests based on artificial intelligence and other technologies, and will be audited to ensure that their determinations are consistent with Medicare coverage criteria. Venders may face penalties for inappropriate denials, such as negative payment adjustments or termination from the model. CMS has also indicated that health care providers who maintain high approval rates under the model may earn an exemption from prior authorization requirements going forward (a practice known as “gold carding”).
Nevertheless, policymakers and others have voiced concern about the financial incentives inherent in the WISeR model, which rewards vendors, in large part, based on the volume of care that they deny, creating financial incentives to maximize denials. Questions have also been raised about the appropriateness of expanding prior authorization in traditional Medicare at a time when its use in private commercial insurance and Medicare Advantage is being more closely scrutinized due to potentially unnecessary delays and denials of care, and hassles for health care providers. In the month since WISeR first launched, hospitals and health care providers have reported difficulties adjusting to the model, including gaps in communication about the new rules and burdensome administrative requirements.
This analysis suggests that the impact of the WISeR model is likely to be modest in its first year, both because the services it targets are used by a relatively small number of beneficiaries and account for a small share of all Part B spending in traditional Medicare, and because CMS has simultaneously put in place nationwide changes to payment policy, beginning January 1, 2026, that are expected to achieve a 90% reduction in spending for the one service, skin substitutes, that accounts for the majority of WISeR service spending and growth in recent years.
However, if the WISeR model expands to include a wider range of services in future years, the scale of its impact may increase with time. Further, despite its drawbacks, prior authorization remains one of the few tools available to insurers to manage health care utilization and spending. The WISeR model represents an opportunity for CMS to test whether this approach can help control Medicare spending by reducing use of unnecessary or inappropriate services, and whether the safeguards put in place by CMS will protect patients against inappropriate delays and denials of care.
Appendix
Appendix Table 1
Services Subject to Prior Authorization Under the WISeR Model
WISeR services by National or Local Coverage Determination (NCD/LCD) and service category
| Category | Service (by NCD/LCD) |
|---|---|
| Orthopedic pain management | Arthroscopic Lavage and Arthroscopic Debridement of the Knee |
| Cervical Fusion | |
| Epidural Steroid Injections for Pain Management Excluding Face Joint Injections | |
| Hypoglossal Nerve Stimulation for Obstructive Sleep Apnea | |
| Induced Lesions of Nerve Tracts | |
| Percutaneous Image-Guided Lumbar Decompression for Spinal Stenosis* | |
| Percutaneous Vertebral Augmentation (PVA) for Vertebral Compression Fracture | |
| Skin Substitutes | Skin and Tissue Substitutes – Applications of Bioengineered Skin Substitutes to Lower Extremity Chronic Non-Healing Wounds |
| Stimulators | Deep Brain Stimulation* |
| Electrical Nerve Stimulators | |
| Phrenic Nerve Stimulator | |
| Sacral Nerve Simulation for Urinary Incontinence | |
| Vagus Nerve Stimulation | |
| Diagnosis and Treatment of Impotence | Diagnosis and Treatment of Impotence |
| Incontinence Control Devices | Incontinence Control Devices |
Note: *Inclusion of this service has been delayed until a future performance year, as of December 23, 2025.
Source: CMS WISeR Model Provider and Supplier Operational Guide, as of December 10, 2025Get the dataDownload PNG
Appendix Table 2
Annual and Quarterly WISeR Service Spending in Traditional Medicare
WISeR service spending in traditional Medicare, by WISeR service category (2019-2025)
| Year | Period | All WISeR Services | Orthopedic Pain Management | Skin Substitutes | Stimulators | Impotence Dx/Tx | Incontinence Control Devices |
|---|---|---|---|---|---|---|---|
| 2019 | Total | $2,422,740,500 | $1,243,406,900 | $509,592,200 | $445,852,400 | $80,304,300 | $146,482,400 |
| Q1 | $579,335,100 | $293,004,700 | $123,331,200 | $106,236,500 | $20,266,400 | $37,289,900 | |
| Q2 | $617,298,000 | $324,140,300 | $123,994,900 | $112,258,500 | $20,189,000 | $37,485,700 | |
| Q3 | $612,132,200 | $319,203,800 | $126,375,500 | $113,433,900 | $18,701,600 | $35,106,100 | |
| Q4 | $613,975,200 | $307,058,200 | $135,890,600 | $113,923,500 | $21,147,300 | $36,600,700 | |
| 2020 | Total | $2,391,016,000 | $1,077,954,000 | $696,231,800 | $422,846,600 | $72,492,300 | $124,242,700 |
| Q1 | $565,951,500 | $276,060,000 | $134,803,600 | $100,646,400 | $18,932,000 | $36,332,700 | |
| Q2 | $457,826,200 | $216,797,400 | $147,563,600 | $64,973,400 | $9,697,500 | $19,205,900 | |
| Q3 | $682,129,100 | $297,592,800 | $202,143,300 | $125,701,700 | $22,091,800 | $35,327,200 | |
| Q4 | $685,109,300 | $287,503,900 | $211,721,300 | $131,525,100 | $21,771,100 | $33,376,800 | |
| 2021 | Total | $3,014,571,900 | $1,197,135,700 | $1,083,479,600 | $514,860,700 | $79,136,400 | $142,969,000 |
| Q1 | $651,527,100 | $265,768,000 | $219,213,200 | $115,644,900 | $19,696,500 | $31,928,400 | |
| Q2 | $792,518,400 | $320,941,200 | $275,589,800 | $135,234,900 | $22,597,700 | $38,929,200 | |
| Q3 | $766,752,300 | $313,937,400 | $273,459,100 | $127,453,000 | $18,058,100 | $34,640,500 | |
| Q4 | $803,774,100 | $296,489,200 | $315,217,400 | $136,527,900 | $18,783,900 | $37,470,900 | |
| 2022 | Total | $3,778,349,900 | $1,081,902,100 | $1,861,909,700 | $597,422,900 | $80,325,400 | $160,161,200 |
| Q1 | $783,535,400 | $261,501,000 | $332,465,200 | $130,777,400 | $19,854,400 | $39,570,200 | |
| Q2 | $901,866,500 | $280,489,600 | $407,764,400 | $152,137,400 | $20,881,200 | $41,652,800 | |
| Q3 | $981,231,200 | $277,248,600 | $492,995,900 | $153,051,100 | $19,760,500 | $39,122,900 | |
| Q4 | $1,111,716,700 | $262,662,900 | $628,684,200 | $161,457,000 | $19,829,300 | $39,815,300 | |
| 2023 | Total | $6,683,869,800 | $1,069,288,200 | $4,670,281,300 | $699,912,800 | $83,978,600 | $163,950,900 |
| Q1 | $1,216,507,700 | $260,094,600 | $729,411,800 | $163,395,600 | $22,285,300 | $42,045,600 | |
| Q2 | $1,529,806,000 | $278,789,100 | $1,012,919,700 | $177,189,600 | $19,939,300 | $41,801,800 | |
| Q3 | $1,779,133,800 | $268,607,600 | $1,274,437,200 | $176,815,400 | $20,254,300 | $39,879,200 | |
| Q4 | $2,158,422,200 | $261,796,900 | $1,653,512,700 | $182,512,300 | $21,499,700 | $40,224,300 | |
| 2024 | Total | $12,296,174,100 | $1,054,230,900 | $10,257,340,900 | $734,002,900 | $81,999,200 | $172,148,900 |
| Q1 | $2,325,399,600 | $247,274,900 | $1,834,590,600 | $176,515,700 | $22,113,100 | $45,700,200 | |
| Q2 | $2,813,628,400 | $272,331,900 | $2,289,260,300 | $189,583,200 | $19,863,000 | $43,183,300 | |
| Q3 | $3,369,167,200 | $269,732,100 | $2,856,112,800 | $182,897,800 | $19,675,800 | $41,782,600 | |
| Q4 | $3,787,978,900 | $264,892,000 | $3,277,377,200 | $185,006,000 | $20,347,300 | $41,482,800 | |
| 2025 | Q1 | $3,850,619,500 | $252,345,000 | $3,340,721,700 | $186,422,700 | $22,683,900 | $49,761,600 |
| Q2 | $4,869,410,100 | $278,164,500 | $4,325,580,900 | $195,269,200 | $21,961,900 | $49,212,600 |
Note: Service category counts may not sum to the total due to overlap, as beneficiaries may have received multiple WISeR services in a single encounter. WISeR services identified by CPT code list included in the CMS WISeR Model Provider and Supplier Operational Guide, as of December 10, 2025. Since this analysis was performed, CMS has delayed the inclusion of two services (deep brain stimulation and percutaneous image-guided lumbar decompression for spinal stenosis). The change accounts for <1% of all traditional Medicare spending on services reflected in this analysis from 2019-2024.
Source: KFF analysis of 100% traditional Medicare outpatient and carrier claims (2019-2025) compiled by L&M Policy Research, based on data derived from the Chronic Conditions Warehouse (CCW)Get the dataDownload PNG
Appendix Table 3
State Variation in WISeR Service Spending and Utilization
Spending and utilization of WISeR services in traditional Medicare, by state (2019 and 2024)
| Total Beneficiaries Receiving WISeR Services | Total Spending on WISeR Services | |||
|---|---|---|---|---|
| State | 2019 | 2024 | 2019 | 2024 |
| AK | 2,100 | 2,500 | $3,784,200 | $6,590,900 |
| AL | 25,300 | 20,400 | $43,818,000 | $145,714,700 |
| AR | 14,900 | 13,400 | $35,761,900 | $112,684,400 |
| AZ | 28,900 | 32,000 | $66,549,300 | $549,134,400 |
| CA | 85,800 | 88,500 | $239,863,200 | $2,389,179,100 |
| CO | 16,700 | 17,500 | $32,522,500 | $173,444,200 |
| CT | 9,300 | 8,300 | $17,043,700 | $40,928,700 |
| DC | 1,300 | 1,400 | $3,302,600 | $11,558,800 |
| DE | 6,000 | 6,600 | $10,379,000 | $48,589,000 |
| FL | 86,700 | 90,800 | $189,395,000 | $1,723,895,100 |
| GA | 36,400 | 32,200 | $80,666,300 | $307,673,100 |
| HI | 1,300 | 1,400 | $3,025,900 | $5,747,500 |
| IA | 13,500 | 11,800 | $25,421,700 | $51,898,500 |
| ID | 6,600 | 6,200 | $13,054,800 | $44,305,800 |
| IL | 45,200 | 42,900 | $92,492,700 | $580,001,500 |
| IN | 29,400 | 24,200 | $57,804,100 | $118,810,300 |
| KS | 19,800 | 19,300 | $45,663,500 | $112,149,500 |
| KY | 17,400 | 15,300 | $33,929,600 | $118,483,300 |
| LA | 19,200 | 16,800 | $46,816,200 | $147,213,900 |
| MA | 26,500 | 26,700 | $57,790,600 | $95,307,100 |
| MD | 25,200 | 25,900 | $57,402,800 | $193,073,800 |
| ME | 4,100 | 2,500 | $8,510,800 | $6,053,500 |
| MI | 30,900 | 21,500 | $71,477,800 | $252,884,600 |
| MN | 17,500 | 16,700 | $32,384,200 | $70,185,700 |
| MO | 27,300 | 21,800 | $60,191,700 | $114,831,300 |
| MS | 16,000 | 13,200 | $37,778,500 | $228,054,800 |
| MT | 5,300 | 5,400 | $10,820,400 | $33,231,600 |
| NC | 42,200 | 33,700 | $76,406,600 | $156,908,300 |
| ND | 4,400 | 3,800 | $8,703,900 | $9,194,600 |
| NE | 9,500 | 9,700 | $22,595,300 | $42,540,000 |
| NH | 5,900 | 5,800 | $12,638,600 | $16,390,500 |
| NJ | 29,000 | 29,000 | $58,280,100 | $309,712,500 |
| NM | 4,400 | 4,300 | $6,753,400 | $55,099,300 |
| NV | 10,100 | 10,200 | $24,651,000 | $353,458,700 |
| NY | 49,100 | 49,200 | $104,455,300 | $361,111,600 |
| OH | 37,500 | 34,100 | $79,495,700 | $225,995,100 |
| OK | 20,100 | 18,300 | $54,791,700 | $358,454,400 |
| OR | 9,100 | 8,200 | $26,090,000 | $128,354,100 |
| PA | 45,700 | 43,500 | $85,882,400 | $190,925,600 |
| RI | 2,500 | 2,300 | $5,006,000 | $6,441,700 |
| SC | 31,300 | 29,200 | $58,452,400 | $177,223,300 |
| SD | 5,800 | 6,600 | $11,829,700 | $17,914,500 |
| TN | 25,100 | 24,200 | $46,145,000 | $154,903,500 |
| TX | 78,500 | 75,600 | $182,275,600 | $1,439,004,200 |
| UT | 12,800 | 13,000 | $24,501,400 | $118,208,400 |
| VA | 34,700 | 33,100 | $60,438,800 | $158,621,300 |
| VT | 1,900 | 1,500 | $1,589,500 | $1,727,100 |
| WA | 21,000 | 18,600 | $45,781,500 | $192,993,300 |
| WI | 17,700 | 15,600 | $32,376,100 | $57,093,500 |
| WV | 4,800 | 4,100 | $11,894,700 | $37,039,600 |
| WY | 2,800 | 3,100 | $4,054,400 | $45,233,900 |
| All WISeR States | 214,900 | 207,500 | $487,173,900 | $3,075,293,800 |
| Total US | 1,117,300 | 1,055,700 | $2,422,740,500 | $12,296,174,100 |
Note: Beneficiary totals for each state may not sum to the national total due to overlap, as beneficiaries may have received services in more than one state. WISeR services identified by CPT code list included in the CMS WISeR Model Provider and Supplier Operational Guide, as of December 10, 2025. Since this analysis was performed, CMS has delayed the inclusion of two services (deep brain stimulation and percutaneous image-guided lumbar decompression for spinal stenosis). The change accounts for <1% of all traditional Medicare spending on services reflected in this analysis from 2019-2024.
Source: KFF analysis of 100% traditional Medicare outpatient and carrier claims (2019-2025) compiled by L&M Policy Research, based on data derived from the Chronic Conditions Warehouse (CCW)Get the dataDownload PNG
Appendix Table 4
State Variation in Per Capita WISeR Service Spending and Utilization
Per capita spending and utilization of WISeR services in traditional Medicare, by state (2019 and 2024)
| Spending on WISeR Services (Per TM Beneficiary) | Beneficiaries Receiving WISeR Services (Per 1,000 TM Beneficiaries) | |||
|---|---|---|---|---|
| State | 2019 | 2024 | 2019 | 2024 |
| AK | $38 | $57 | 20.9 | 21.4 |
| AL | $73 | $322 | 41.9 | 45.1 |
| AR | $76 | $303 | 31.9 | 36.0 |
| AZ | $85 | $742 | 37.1 | 43.2 |
| CA | $68 | $700 | 24.3 | 25.9 |
| CO | $62 | $351 | 31.7 | 35.3 |
| CT | $43 | $124 | 23.3 | 25.2 |
| DC | $44 | $179 | 16.8 | 20.9 |
| DE | $60 | $293 | 34.7 | 39.9 |
| FL | $78 | $770 | 35.7 | 40.5 |
| GA | $78 | $352 | 35.1 | 36.9 |
| HI | $21 | $40 | 8.6 | 9.6 |
| IA | $53 | $121 | 27.8 | 27.5 |
| ID | $60 | $220 | 30.2 | 30.9 |
| IL | $57 | $422 | 27.8 | 31.2 |
| IN | $68 | $171 | 34.3 | 34.8 |
| KS | $105 | $286 | 45.5 | 49.2 |
| KY | $55 | $259 | 28.4 | 33.4 |
| LA | $88 | $356 | 36.1 | 40.5 |
| MA | $58 | $102 | 26.6 | 28.5 |
| MD | $63 | $221 | 27.7 | 29.7 |
| ME | $39 | $38 | 18.8 | 15.5 |
| MI | $60 | $293 | 25.8 | 24.9 |
| MN | $58 | $151 | 31.5 | 35.8 |
| MO | $78 | $184 | 35.5 | 35.0 |
| MS | $79 | $622 | 33.4 | 36.1 |
| MT | $58 | $180 | 28.6 | 29.4 |
| NC | $62 | $159 | 34.0 | 34.0 |
| ND | $82 | $95 | 40.8 | 39.1 |
| NE | $79 | $168 | 33.2 | 38.1 |
| NH | $52 | $73 | 24.2 | 25.6 |
| NJ | $51 | $294 | 25.5 | 27.5 |
| NM | $25 | $237 | 16.5 | 18.6 |
| NV | $75 | $1,197 | 30.7 | 34.6 |
| NY | $49 | $193 | 23.1 | 26.2 |
| OH | $60 | $202 | 28.4 | 30.5 |
| OK | $95 | $748 | 34.9 | 38.2 |
| OR | $56 | $300 | 19.4 | 19.2 |
| PA | $55 | $138 | 29.2 | 31.4 |
| RI | $42 | $65 | 20.7 | 23.3 |
| SC | $78 | $266 | 41.9 | 43.8 |
| SD | $86 | $141 | 42.3 | 52.0 |
| TN | $57 | $220 | 31.1 | 34.5 |
| TX | $73 | $651 | 31.7 | 34.2 |
| UT | $98 | $530 | 51.2 | 58.1 |
| VA | $51 | $152 | 29.5 | 31.8 |
| VT | $12 | $15 | 14.4 | 13.3 |
| WA | $51 | $247 | 23.4 | 23.8 |
| WI | $49 | $101 | 26.8 | 27.6 |
| WV | $41 | $177 | 16.7 | 19.5 |
| WY | $39 | $433 | 26.9 | 29.8 |
| All WISeR States | $68 | $482 | 29.9 | 32.5 |
| Total US | $64 | $371 | 29.6 | 31.9 |
Note: Per capita spending and utilization values are left unrounded. Beneficiary totals for each state may not sum to the national total due to overlap, as beneficiaries may have received services in more than one state. WISeR services identified by CPT code list included in the CMS WISeR Model Provider and Supplier Operational Guide, as of December 10, 2025. Since this analysis was performed, CMS has delayed the inclusion of two services (deep brain stimulation and percutaneous image-guided lumbar decompression for spinal stenosis). The change accounts for <1% of all traditional Medicare spending on services reflected in this analysis from 2019-2024.
Source: KFF analysis of 100% traditional Medicare outpatient and carrier claims (2019-2025) compiled by L&M Policy Research, based on data derived from the Chronic Conditions Warehouse (CCW)Get the dataDownload PNG
.png)
Appendix Table 5
State Variation in Per Capita Spending and Utilization of Skin Substitutes
Per capita spending and utilization of skin substitutes in traditional Medicare, by state (2019 and 2024)
| Spending on Skin Substitutes (Per TM Beneficiary) | Beneficiaries Receiving Skin Substitutes (Per 1,000 TM Beneficiaries) | Price Per Service for Skin Substitutes | ||||
|---|---|---|---|---|---|---|
| State | 2019 | 2024 | 2019 | 2024 | 2019 | 2024 |
| AK | $9 | $27 | 0.9 | 0.9 | $2,200 | $10,150 |
| AL | $10 | $244 | 1.4 | 4.5 | $2,400 | $14,650 |
| AR | $7 | $199 | 0.9 | 2.5 | $2,100 | $17,750 |
| AZ | $19 | $646 | 2.2 | 4.4 | $2,350 | $34,900 |
| CA | $23 | $652 | 1.8 | 4.0 | $2,900 | $27,300 |
| CO | $7 | $275 | 1.2 | 2.4 | $1,800 | $22,200 |
| CT | $9 | $81 | 1.4 | 1.9 | $1,950 | $8,650 |
| DC | $14 | $121 | 2.2 | 2.1 | $2,400 | $14,950 |
| DE | $7 | $215 | 1.2 | 2.3 | $1,650 | $17,950 |
| FL | $13 | $687 | 2.0 | 6.0 | $2,000 | $26,750 |
| GA | $17 | $269 | 2.1 | 3.5 | $2,350 | $16,150 |
| HI | $5 | $19 | 0.5 | 1.1 | $2,450 | $5,750 |
| IA | $18 | $71 | 2.1 | 2.0 | $2,500 | $7,050 |
| ID | $14 | $158 | 2.0 | 2.2 | $2,100 | $13,450 |
| IL | $15 | $376 | 1.8 | 3.4 | $2,000 | $20,700 |
| IN | $16 | $112 | 2.0 | 2.9 | $2,300 | $7,950 |
| KS | $29 | $187 | 3.1 | 4.1 | $2,400 | $7,900 |
| KY | $8 | $195 | 1.3 | 3.3 | $2,050 | $14,300 |
| LA | $29 | $284 | 1.7 | 3.0 | $4,000 | $19,300 |
| MA | $11 | $44 | 1.4 | 1.5 | $2,000 | $7,250 |
| MD | $9 | $155 | 1.0 | 1.4 | $3,050 | $23,250 |
| ME | $9 | $9 | 1.3 | 1.3 | $1,650 | $1,650 |
| MI | $12 | $247 | 1.4 | 2.1 | $2,150 | $22,200 |
| MN | $9 | $83 | 1.1 | 1.7 | $2,200 | $8,950 |
| MO | $16 | $108 | 2.1 | 3.1 | $2,000 | $7,750 |
| MS | $13 | $530 | 1.6 | 4.1 | $2,850 | $24,200 |
| MT | $8 | $130 | 1.4 | 2.0 | $2,000 | $11,100 |
| NC | $11 | $102 | 1.4 | 1.8 | $2,450 | $12,450 |
| ND | $11 | $15 | 1.4 | 1.6 | $1,550 | $2,050 |
| NE | $14 | $81 | 1.8 | 2.1 | $2,000 | $7,850 |
| NH | $6 | $26 | 0.7 | 1.4 | $1,900 | $4,700 |
| NJ | $10 | $245 | 1.4 | 2.1 | $2,150 | $25,000 |
| NM | $5 | $210 | 0.7 | 1.6 | $1,800 | $22,450 |
| NV | $13 | $1,136 | 1.7 | 7.1 | $2,200 | $27,400 |
| NY | $11 | $147 | 1.5 | 1.9 | $1,950 | $17,650 |
| OH | $10 | $143 | 1.7 | 2.1 | $1,850 | $14,600 |
| OK | $16 | $674 | 1.5 | 3.7 | $2,750 | $27,650 |
| OR | $12 | $258 | 1.2 | 2.1 | $2,500 | $23,050 |
| PA | $10 | $75 | 1.6 | 1.6 | $2,100 | $11,250 |
| RI | $17 | $30 | 2.5 | 1.7 | $1,750 | $4,100 |
| SC | $12 | $190 | 1.8 | 3.0 | $2,200 | $14,750 |
| SD | $19 | $21 | 2.2 | 2.4 | $2,450 | $2,850 |
| TN | $9 | $158 | 1.2 | 2.6 | $2,000 | $12,550 |
| TX | $16 | $580 | 1.7 | 3.8 | $2,550 | $28,100 |
| UT | $26 | $436 | 2.2 | 4.2 | $3,200 | $17,900 |
| VA | $8 | $101 | 1.2 | 2.3 | $2,050 | $11,550 |
| VT | $1 | $5 | 0.2 | 0.3 | $700 | $4,550 |
| WA | $13 | $203 | 1.4 | 2.3 | $1,950 | $19,600 |
| WI | $14 | $56 | 1.6 | 1.6 | $2,000 | $6,850 |
| WV | $9 | $135 | 1.3 | 2.3 | $1,950 | $9,250 |
| WY | $4 | $388 | 1.0 | 2.0 | $1,350 | $41,400 |
| All WISeR States | $14 | $417 | 1.7 | 3.1 | $2,300 | $26,800 |
| Total US | $13 | $310 | 1.6 | 3.0 | $2,300 | $21,200 |
Note: Per capita spending and utilization values are left unrounded. Price per service values are rounded to the nearest $50. Beneficiary totals for each state may not sum to the national total due to overlap, as beneficiaries may have received services in more than one state. WISeR services identified by CPT code list included in the CMS WISeR Model Provider and Supplier Operational Guide, as of December 10, 2025. Since this analysis was performed, CMS has delayed the inclusion of two services (deep brain stimulation and percutaneous image-guided lumbar decompression for spinal stenosis). The change accounts for <1% of all traditional Medicare spending on services reflected in this analysis from 2019-2024.
Source: KFF analysis of 100% traditional Medicare outpatient and carrier claims (2019-2025) compiled by L&M Policy Research, based on data derived from the Chronic Conditions Warehouse (CCW)Get the dataDownload PNG
Methods
KFF contracted with L&M Policy Research for data on utilization and spending trends for services included in the CMMI WISeR model. The data included Medicare fee-for-service claims from 2019 to Q2 2025 through L&M’s data license with Centers for Medicare and Medicaid Services and its access to the Chronic Condition Warehouse Virtual Research Data Center (CCW VRDC). The sample consisted of 100% Medicare fee-for-service carrier and outpatient claims with non-zero Medicare payments for beneficiaries with Medicare as the primary payer, restricted to providers located in the 50 states or the District of Columbia. Estimates of Part B payment rates were derived from the Part B Use-Specific Per Capita Cost (USPCC) rates from the CMS 2026 Part B Rate Book, updated as of April 2025.
To capture the full set of costs associated with services included in the WISeR Model, utilization was defined at the service-day level, anchored by the presence of at least one claim containing a HCPCS/CPT code identified in the WISeR Model Provider and Supplier Operational Guide (Version 3.0). For each beneficiary, all outpatient claims containing a WISeR HCPCS/CPT code and all carrier claims occurring on the same calendar day as carrier or outpatient claims with a WISeR code were aggregated to represent a single service. Costs were calculated as the sum of Medicare payments associated with those claims.
When multiple place-of-service (POS) codes were present across claims for the same service day, a single POS category was assigned using a hierarchical approach (outpatient, ambulatory care setting, physician office, home, and other), and all associated payments were attributed to the assigned category. Carrier claims billed with an outpatient POS were retained only when they could be matched to an outpatient claim with a non-zero Medicare payment on the same date, in which case the corresponding payments were classified as outpatient spending. Since HCPCS/CPT codes for different WISeR services may occur on the same service day, an additional grouping exercise was conducted that assigns services to broader, mutually exclusive modalities to limit overlap in attributed costs.
This analysis did not assess whether services were appropriate based on medical best practices or other clinical criteria.
This work was supported in part by Arnold Ventures. KFF maintains full editorial control over all of its policy analysis, polling, and journalism activities.
Alex Cottrill, Jeannie Fuglesten Biniek, Juliette Cubanski, and Tricia Neuman are with KFF. Misha Segal is with L&M Policy Research. L&M Policy Research contributed to the data analysis and provided additional project support.


 Retires Before Completing His Term?")